

If someone asked you what the customers you acquired last May are worth to your business today, could you give them a real answer?
Most DTC brands can't.
They can tell you last month's total revenue, this quarter's order count, year-over-year topline growth.
But the moment you narrow the question to a specific group of customers and how they've behaved since you acquired them, the data just... isn't there in a useful form.
That's the gap a proper Shopify cohort analysis closes.
It's the difference between looking at the scoreboard and studying the game film.
The scoreboard tells you whether you won last month. The film tells you why — and whether the thing that won it is repeatable.
Your Shopify store has been quietly recording that film the entire time.
Every first order, every repeat, every cohort's trajectory. The question is whether you're watching it.
Here are five KPIs sitting in that footage that most ecommerce brands never pull out — each one capable of changing how you think about acquisition, retention, and how hard you can actually push.
Quick caveat before we dive in: cohort analysis only sees customers who actually completed a first purchase. The leak before that — cart abandonment — is its own separate problem, currently hovering at a record 77% across ecommerce. But once someone's past the checkout, the cohort is where the real story lives.
We built a free LTV model template that pulls this data straight from Shopify and calculates all five for you — more on that at the end.
1. Your Retention Curve
If I asked you what percentage of your customers place a second order within 30 days of the first, do you know the number? What about within 90 days? A year?
Your retention curve answers all of those questions, in one shape.
Here's how it's built.
Take everyone who placed their first order in May. That's your May cohort.
By definition, 100% of them purchased in May — that's what got them into the group.
Then you track what happens afterwards.
In June, maybe 21% placed another order. In July, 13%. August, 10%. The tail keeps dropping and eventually flattens.
Do that for every cohort, line them up side by side, and a shape emerges.
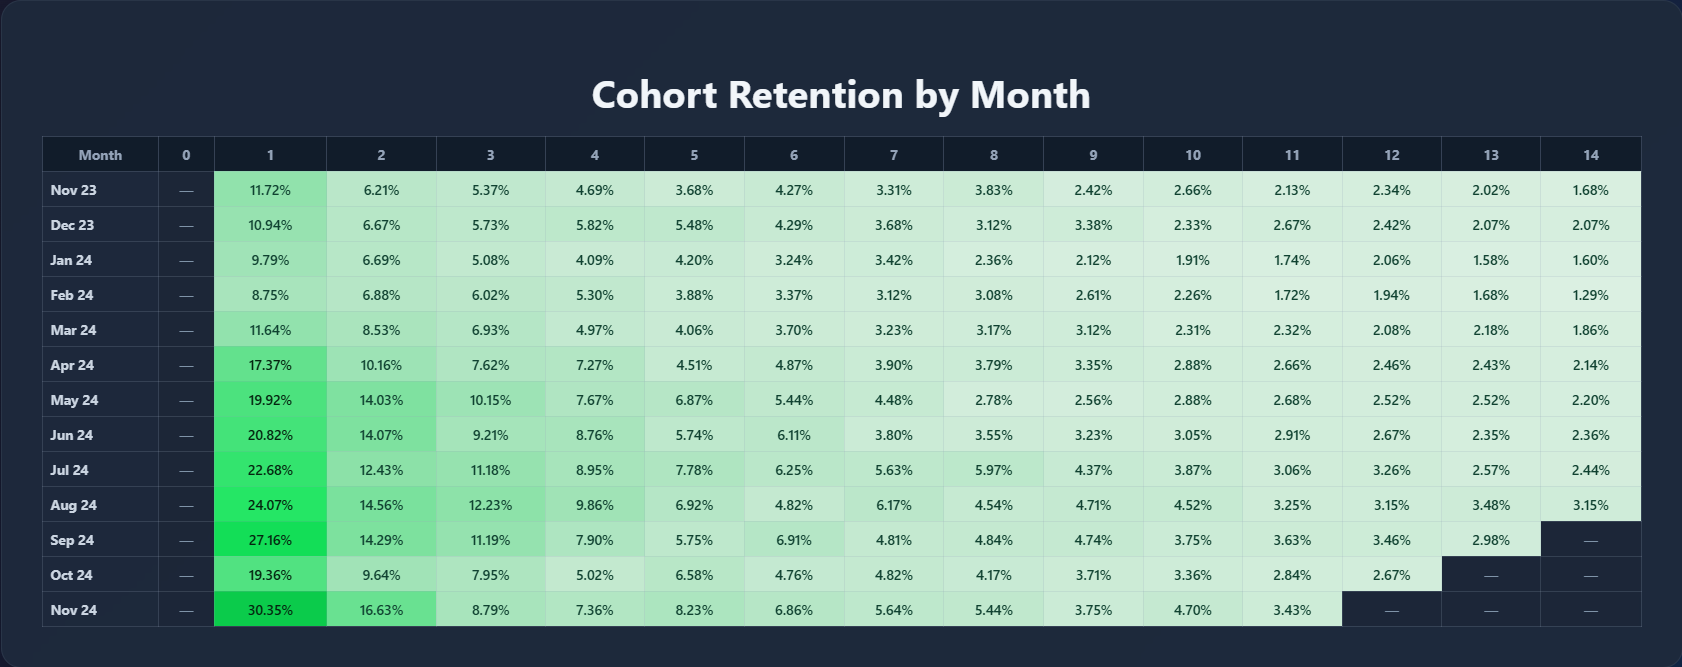
That shape is how your customers actually behave — not how you wish they behaved, not what an industry report claims the average is.
What yours do, in your ecommerce store, on your product.
One subtlety that's easy to miss: a straight average across every cohort treats a 2,000-customer month and a 200-customer month as equally informative.
They're not.
The larger cohort is giving you a much higher-resolution reading of real customer behavior — more signal, less noise.
A weighted average — one that scales each cohort's contribution to its size — gives you a curve that reflects where the mass of your customers actually live, not where a quiet month happened to land.
2. Lifetime Gross Profit
Most ecommerce brands talk about customer lifetime value — LTV. The average ecommerce CLV currently sits around $1,609, which is useful as a sanity check but not much more than that.
The problem is that LTV is a revenue number.
It tells you how much a customer will spend over time, but revenue doesn't pay rent — margin does.
Lifetime gross profit is the dollar-for-dollar version of the same question. And the retention curve is what makes it calculable.
The mechanic is straightforward once you see it.
The curve tells you, for a typical customer, how many additional orders they're expected to place over a given window.
Multiply that by your returning-customer AOV to get expected repeat revenue.
Add the first order.
Apply your gross margin.
What's left is the actual margin a customer generates at 3 months, 6 months, 12 months, 24 months — their LTGP at each horizon.
Why does this matter more than LTV?
Because margin ranks customers differently than revenue does.
A customer with a $200 LTV at 30% margin is worth $60 in LTGP.
A customer with a $150 LTV at 55% margin is worth $82.50.
The "bigger" customer on the revenue chart is the smaller one on the only chart that pays for anything.
Acquisition targets built off LTV can quietly invert which customers you should actually want more of.
And since LTGP is a function of AOV and margin, both of those are levers — not fixed inputs. Deliberate pricing decisions can meaningfully shift your LTGP without touching retention at all. 10 ecommerce pricing tactics worth knowing if that's the lever you want to pull first.
3. Your CAC Ceiling
Once you have LTGP, a hard number falls out of it: the highest CAC an ecommerce brand can run without losing money on every customer it acquires.
Think of it like the water line on a boat.
Below the line, you float. Different loads affect speed and handling, but the boat stays up.
Above the line, physics stops cooperating — and the more cargo you stack, the faster it goes under.
CAC above LTGP works the same way. Every additional customer you acquire is weight added to a boat that's already taking water.
For the full walkthrough on how to set an ecommerce CAC target from the ground up — not just the ceiling, but the actual operating number — we covered it here.
But there isn't just one ceiling — there are several, stacked.
Your 3-month LTGP is one ceiling.
Your 12-month is higher.
Your 24-month higher still.
For a DTC brand, which one you actually operate against is less a math question and more a cash question: how long can you wait for the later-horizon margin to actually materialize? Which is the next KPI.
4. Payback Period
A customer is profitable over 12 months. Great. Can your bank account wait 12 months?
Payback period is the answer. It's the number of months it takes for the cumulative gross profit from a customer to exceed what you paid to acquire them.
Let's put numbers on it so it isn't abstract.
Say your AOV on a first order is $85 and your gross margin is 60%. That's roughly $51 of gross profit out of the first purchase alone.
At a $40 CAC, you clear $11 on order one — zero-month payback, you're already ahead.
At a $51 CAC, you break even in month one.
At $70, you're $19 underwater after the first order — whether that closes in month two, month three, or month six depends entirely on how quickly repeat orders arrive and what they're worth.
At $95, you're $44 in the hole from order one, and you're probably looking at several repeats — four to six months, realistically — before that customer actually crosses into profitable territory.
Those specific numbers are illustrative, but the pattern isn't.
The higher your CAC climbs toward your LTGP ceiling, the longer the payback stretches — and the more working capital you need parked between acquisition and profitability, just to keep the machine fed.
That's not a finance footnote. It's the operational constraint that quietly governs how aggressive you're allowed to be.
Which is why the other half of this equation isn't retention at all — it's the cash you have on hand to bridge the gap. 15 Ways to Improve Cash Flow for Ecommerce Brands covers the operational side of that, and the shorter your payback window looks, the more aggressive a CAC target your balance sheet can actually support.
5. Your CAC/Spend Sweet Spot
This is where the other four KPIs stop being individual metrics and start answering a single question: what combination of CAC and monthly spend puts the most dollars in your pocket?
Most ecommerce brands treat CAC as a single fixed target — "we aim for $50."
But CAC and spend are coupled.
To acquire more customers, you typically have to accept a higher CAC, because you're bidding into progressively less efficient ad inventory.
The interesting question isn't which one you can push to an extreme. It's where the product of the two lands.
Here's the kind of thing that falls out when you actually plot it.
Picture a brand running at a $50 CAC and $120k in monthly spend — call it 2,400 new customers a month, and assume that shakes out to roughly $32k in contribution profit once you apply LTGP over their payback window.
Someone on the team says "let's tighten up and get CAC down to $45."
Good instinct, except pulling CAC that low might mean cutting spend to $95k.
Now it's about 2,100 customers and maybe $28k in profit. Efficiency per customer went up. Total profit went down.
Flip it.
What if relaxing CAC to $55 opens up $180k in viable spend?
3,270 customers, and if retention holds, the same brand might clear $42k. The version that "let CAC rise" ended up more profitable than the version that optimized for efficiency.
The real answer for any given brand lives in a grid — every realistic CAC on one axis, every realistic spend level on the other, profitability filled into each cell.
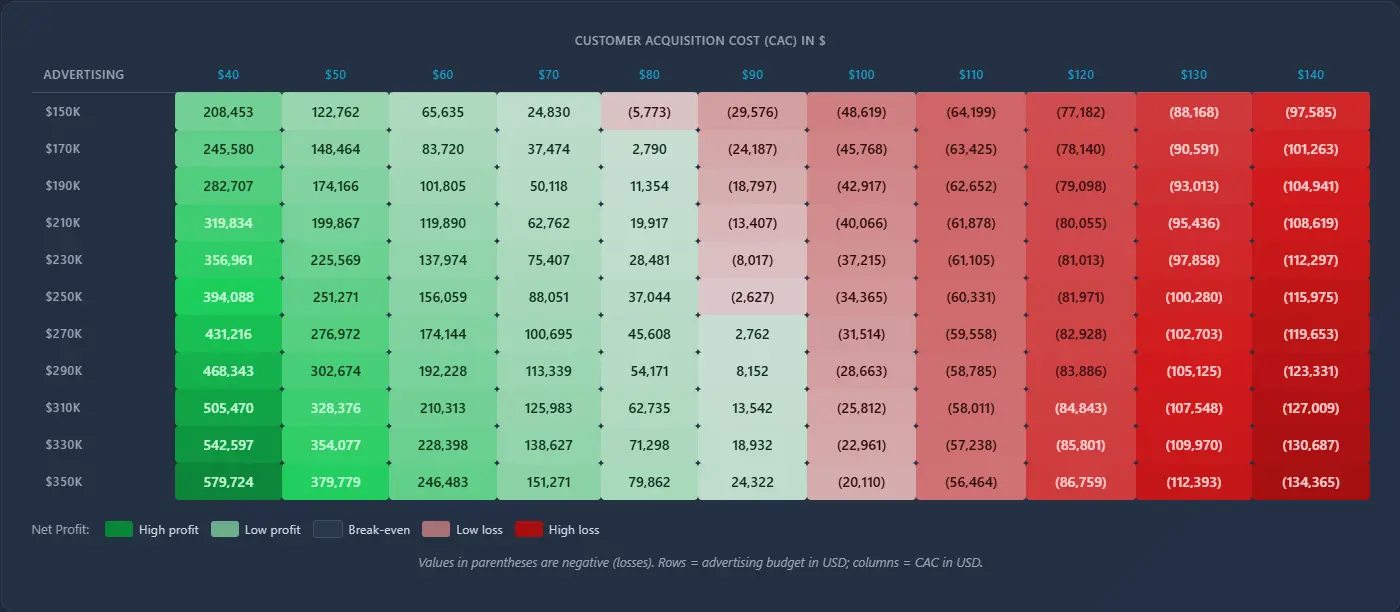
That grid is where you can actually see which combinations compound, which collapse, and where the sweet spot genuinely sits.
This is exactly what the sensitivity table in our free LTV model lays out — every CAC and spend combination, with the resulting profitability in plain view. If you want to see it for your own numbers, [link to template].
One Wrinkle That Can Make the Whole Picture Lie
There's a structural quirk in cohort data that's worth flagging before you make any big decisions off it.
The cohorts with the most complete purchase history are also the cohorts least representative of your current brand.
Think about what that means in practice.
If you launched a loyalty program eight months ago, rewrote your onboarding emails last spring, or swapped in a better hero product in Q2 — the only cohorts sitting on 12 or 18 months of accumulated data predate all of that. They were acquired by an older version of the business.
So when the model estimates what a current customer is worth over 12 months, it's quietly leaning on behavior from before you made the thing better.
That tends to pull your long-horizon LTGP estimates lower than they actually are.
Which drags your CAC ceiling down with them.
Which leaves you running more conservatively on spend than your real economics would support.
You can end up underfunding acquisition because the model is still grading you on an old exam.
Now — and this is the part that gets abused — the same logic can be twisted the other way to manufacture optimism.
"Our packaging is nicer now, so obviously our 24-month retention will double."
That's not an adjustment. That's a wish.
The honest version lives in between.
Look at where the improvement actually shows up in the measurable window.
If your last three cohorts are retaining noticeably better in months one through three, it's reasonable to carry some portion of that gain forward into your later-month projections.
Not all of it. Not zero.
Just pick a multiplier you can defend out loud, and be honest with yourself about what's evidence and what's hope.
The Bigger Picture
None of these five KPIs stand on their own. The retention curve feeds your LTGP. LTGP sets your CAC ceiling. Your cash position narrows that ceiling down to a payback-adjusted version.
And those, crossed with your realistic spend range, define the sweet spot.
Miss one of them and the rest shift. Get all five honest, and you're not guessing at your acquisition strategy anymore — you're reading it off a chart.
All of this is sitting in your Shopify cohort data already. It just needs to be pulled out and structured.
We built a free LTV model that does exactly that. Export your Shopify data, paste it in, and the template calculates all five KPIs for you.


.jpg)


