
How did you land on your current CAC target?
If you're being honest, it probably came from one of two places: you divided your AOV by something that felt reasonable, or you heard a number on a podcast and figured it was close enough...
And look — that's not a terrible starting point.
You needed a number, you picked one, you moved on.
That's how most ecommerce brands operate.
But here's the question worth sitting with: what is your CAC actually tied to?
Because a CAC target should be a function of something real — your retention, your margins, how much you can actually spend at that level before profitability falls apart.
If it's not grounded in those things, then it's just a number you're defending out of habit.
And defending a number you can't trace back to anything is how you end up either leaving money on the table or bleeding cash without realizing it.
So let's walk through how to actually set one.
We also built a free LTV model template that lets you plug in your own Shopify data and see all of this for your brand — more on that at the end.
Start With Your Hard Limit
Think about a money printer that costs $10 to run but only prints a $5 bill.

Nobody in their right mind would turn it on.
And yet, the moment your CAC exceeds what a customer will ever return in margin, that's exactly what you're operating — a machine that destroys money at scale, dressed up as a growth strategy.
The number that keeps you on the right side of that line is your lifetime gross profit — the total margin a customer generates across every order they'll ever place with you, after COGS.
That's your ceiling. Go above it, and no amount of volume or efficiency saves you.
Most brands aren't above that line — but most also can't tell you where the line actually is.
They're somewhere below it, hoping the gap is wide enough.
That's a very different thing than knowing exactly how much room you have to work with.
So How Do You Find That Line?
You need cohort data.
Not an ecommerce lifetime value estimate you pulled from a dashboard — actual cohort-level purchasing behavior.
What does that mean in practice?
You take the customers you acquired in, say, May. You watch what they do.
In their first month, they all placed at least one order — that's how they got into the cohort.
Then in June, some percentage came back. In July, a smaller percentage. August, smaller still.
When you line that up across enough months and enough cohorts, a pattern emerges.
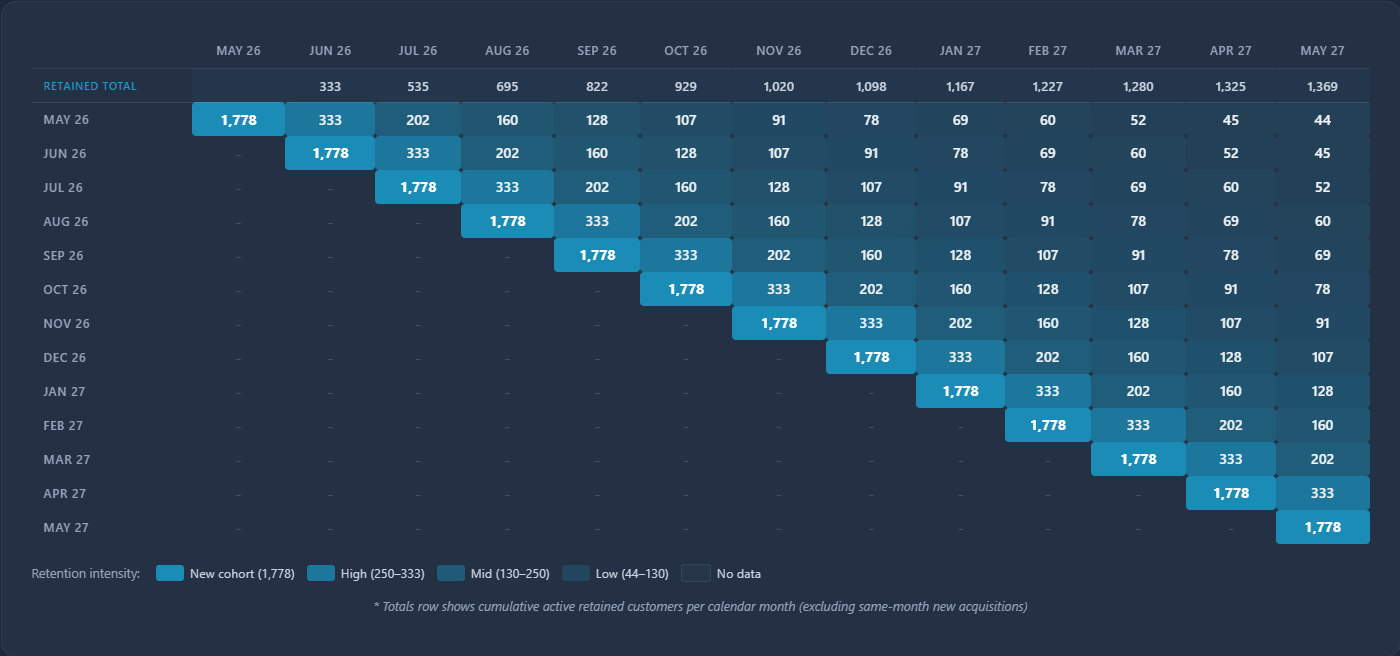
That's your retention curve.
It tells you how your customers actually behave — not how you hope they behave, not what an industry benchmark says they should do, but what they do.
Combine that curve with your AOV and gross margin and you get your lifetime gross profit at 3 months, 6 months, 12 months, 24 months.
Now you're not guessing at your CAC ceiling. You're reading it off a chart.
The thing worth asking at this point: have you ever actually looked at your Shopify cohort data this way? Most DTC brands never pull it.
A Lower CAC Isn't Always the Move
This one's counterintuitive, so stay with me.
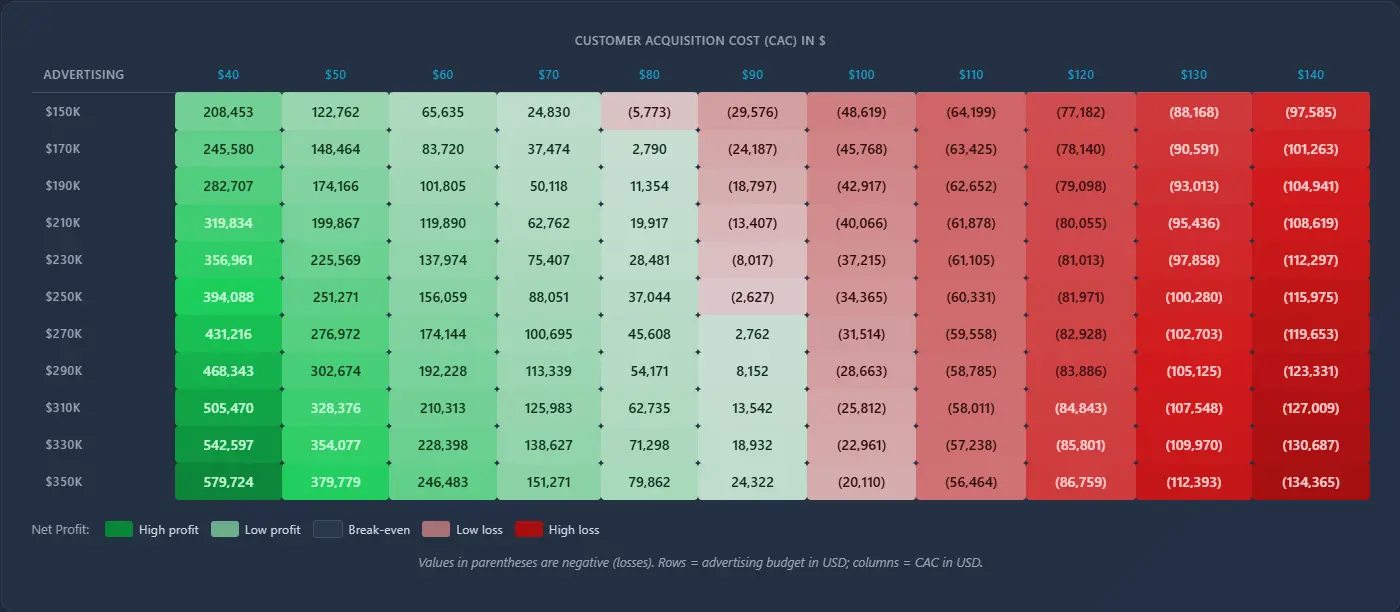
Let's say you're at a $70 CAC and spending $190k/month.
That combination gives you roughly $50k in profitability. Solid.
Now someone on your team says "we should try to get CAC down to $60." Sounds smart, right? More efficient acquisition.
But what if getting to a $50 CAC means pulling spend back to $170k?
You might end up with less total profit, not more. You got more efficient per customer but acquired fewer of them.
Now flip it.
What if you let CAC rise to $80 — but that opens up $270k in spend?
Depending on your retention and margins, that could net you more total profitability than the $70 scenario.
Those are very different questions, and they lead to very different decisions.
Here's where it gets uncomfortable though: if you only increase CAC to $80 but can only push spend to $230k, your profitability actually drops — from $50k to $28k.
Same CAC increase, completely different outcome depending on how much volume it opens up.
So the discipline isn't just in lowering CAC. It's in understanding the relationship between CAC, spend, and what comes out the other side.
This is exactly what the sensitivity table in our free LTV model shows you — every combination of CAC and spend, with the resulting profitability laid out.
Cash Flow Changes the Answer
There's another layer to this that's easy to overlook when you're staring at a 12-month LTV number.
Say your three-month lifetime gross profit is $99 per customer.
If your CAC is $90, you'll make that money back — eventually.
But it's going to take a month or two after acquisition before that customer is in the black.
If you're spending $190k/month on acquisition, that's a lot of cash tied up waiting for payback.
A well-capitalized DTC brand might look at that and say "fine, we can float it."
A brand that's tighter on cash has to ask a harder question: can I actually afford to wait that long?
This is why payback period matters just as much as lifetime profitability.
Two brands with the exact same retention curve and margins might need completely different CAC targets — not because the math is different, but because their cash positions are.
So when you're setting your target, ask yourself: am I solving for maximum lifetime profit, or am I solving for what I can actually sustain month to month?
Both are valid. But they'll give you different numbers, and you should know which one you're using.
Your Recent Improvements Might Not Show Up in the Data Yet
This is a subtle one, but it trips up a lot of brands.
Say you overhauled your post-purchase flows six months ago.
Maybe you launched a subscription option, redesigned your email sequences, improved your product or pricing bundles.
And it's working — your recent cohorts are retaining noticeably better in months one through four.
But when you try to look at what happens in month 12 or month 18, those improved cohorts haven't been around long enough to tell you.
The only cohorts with that much history are the older ones — the ones from before you made the changes.
So your long-term retention estimates end up anchored to behavior that may no longer reflect reality.
That can make your LTV projections look worse than they should.
Which means your CAC ceiling looks lower than it actually is.
Which means you might be holding back on spend for no good reason.
Now — and this is important — some brands use this exact logic to justify wildly optimistic assumptions.
"Oh, our retention is definitely going to be better because we changed our packaging."
That's not analysis, that's wishful thinking.
The honest version sounds more like: "Our month-one and month-two retention improved by 40% in the last three cohorts. It's reasonable to assume that'll carry through to later months to some degree."
That's a judgment call grounded in data. Make the adjustment, but don't lie to yourself about it.
Putting It All Together
Setting an ecommerce CAC target that actually means something comes down to a handful of inputs:
- Your retention curve — from real cohort data, not a dashboard estimate
- Your AOV and gross margin — split between new and returning customers
- Your spend capacity — what you can actually deploy at different CAC levels
- Your payback tolerance — how long you can afford to wait for a customer to turn profitable
When you run those through an LTV model, you get a sensitivity table — every combination of CAC and spend level, with the resulting profitability staring back at you.
That's where the answer lives.
Not in a single CAC target, but in understanding which combinations work for your ecommerce business and which ones quietly destroy margin while looking like growth.
The goal isn't the lowest CAC. It's the combination that maximizes the total contribution margin you can reinvest. Once you see it laid out, the right target tends to be pretty obvious.
We built a free LTV model that does exactly this — plug in your Shopify data and see the full picture. Grab it here.


.jpg)


