
You've probably heard people throwing around ROAS numbers like they mean something.
"We're hitting 5x ROAS!"
Cool. But what does that actually tell you?
Is your 3x ROAS terrible, or are you crushing it compared to everyone else in your space?
ROAS – Return on Ad Spend – is basically this: for every dollar you put into ads, how many dollars are you getting back?
Simple math. But the meaning behind that number? That's where it gets interesting.
What should you be aiming for?
And more importantly – when should you stop obsessing over ROAS and look at something else entirely?
That's what we're breaking down here.
No fluff, just the benchmarks you need to know, organized by industry and platform, so you can figure out where you stand and whether your ad spend is actually working for you.
Let's get into it.
What is a "Good" ROAS for eCommerce?
Here's the answer everyone wants: 4:1.
Four dollars back for every dollar spent.
That's the magic number you'll see thrown around everywhere.
And sure, it's a decent benchmark. But let's be honest – it's also kind of useless without context.
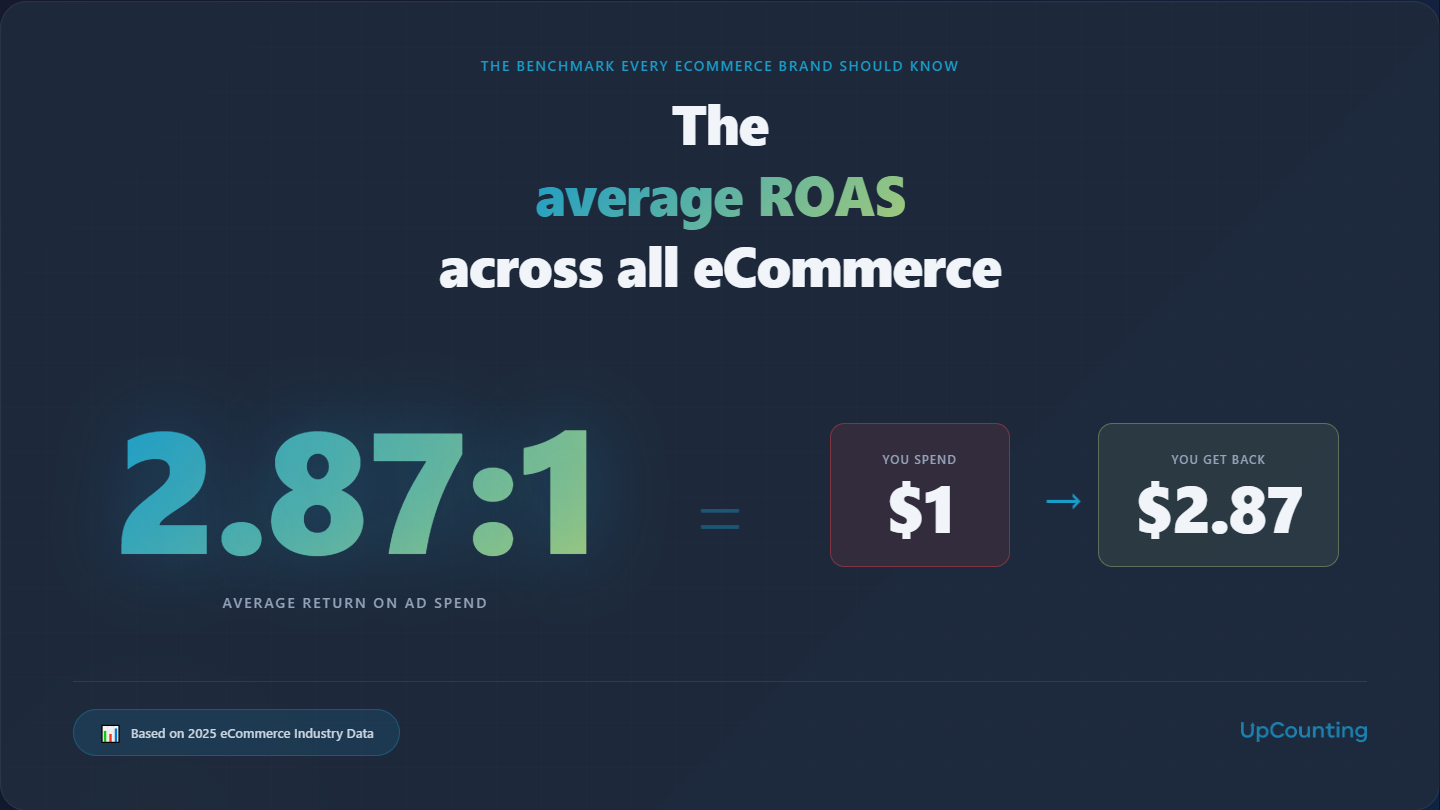
What is the average ROAS for eCommerce?
The average ROAS across all ecommerce is 2.87:1 – meaning you get $2.87 back for every dollar spent on advertising.
That's the middle of the road. Not great, not terrible. Just... average.
But here's what's more telling: the median ROAS for brands in 2024 was 2.04.
That means half of all ecommerce businesses are operating below a 2:1 ratio. Half. Let that sink in.
Most experts will tell you a "good" ROAS typically ranges from 2:1 to 4:1, meaning you generate $2-4 in revenue for every $1 spent on advertising.
But if you've been in this game for more than five minutes, you know that's an oversimplification.
A luxury watch store with 80% margins and a dropshipping phone case shop can both hit a 2.87:1 ROAS.
One's making bank, the other's barely covering costs. The number by itself tells you almost nothing without context.
So when you look at these platform benchmarks below, remember – they're guides, not gospel.
The real question isn't "what's a good ROAS?" It's "what ROAS do I need to hit my profit goals?"
Because at the end of the day, ROAS is just one piece of the puzzle.
You could have a 10:1 ROAS and still go out of business if you're only spending $100 a month on ads.
Volume matters. Profit margins matter. Customer lifetime value matters.
But benchmarks? They give you a starting point.
A way to see if you're in the ballpark or completely off track.
And that's exactly what we're about to show you.
Average eCommerce ROAS by Industry
If you're comparing your jewelry store's ROAS to some random case study from a software company, you're setting yourself up for frustration.
Different industries have different customer behaviors, different price points, different repeat purchase rates – all of that changes what "good" looks like.
So here's what the actual data shows across major ecommerce industries:
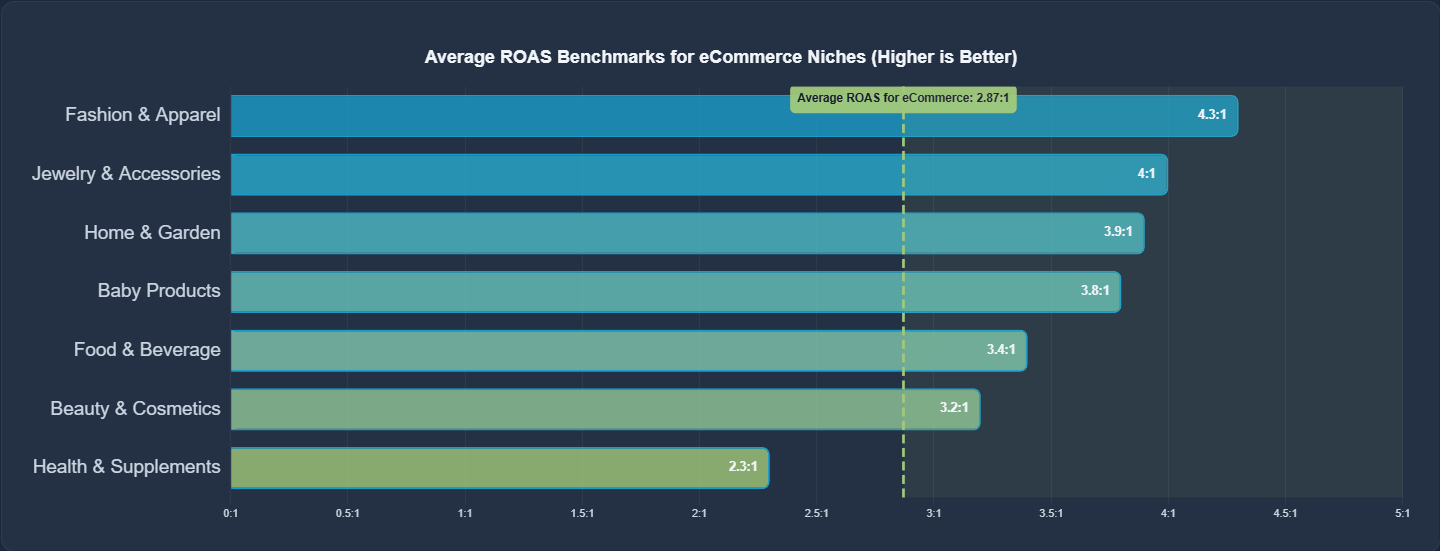
Fashion & Apparel: ~4.3:1
Fast-moving, trend-driven category with solid performance. The impulse-purchase nature and visual appeal of fashion products tend to drive stronger returns on platforms like Instagram.
Beauty & Cosmetics: 2.8 to 3.6:1
This category presents unique challenges – shoppers research, compare options, and seek social proof before buying.
Skincare routines require commitment, so buyers approach new brands cautiously.
Recent data shows beauty's social ROAS jumped to 3.50 in Q1 2025 after dipping during the holiday season.
Health & Supplements: ~2.3:1
Lower initial ROAS, but here's the thing – subscription model potential changes everything. The real value is in customer lifetime value, not the first purchase.
A 3:1 ROAS is actually excellent for supplements because brands can scale quickly knowing the backend revenue is strong.
Baby Products: 3.7 to 3.9:1
New parents are motivated buyers who prioritize quality and safety. Their urgency and willingness to pay premium prices for trusted products boost returns significantly.
Jewelry & Accessories: ~4.0:1
High perceived value and emotional purchases work in your favor here. Gift-giving occasions and special events create natural buying momentum.
Home & Garden: 3.8 to 4.0:1
Seasonal swings are real in this category. Spring and summer typically perform better, so factor that into your expectations throughout the year.
Food & Beverage: ~3.4:1
Repeat purchase potential exists, but shipping costs can be brutal.
If you're not building repeat customers or haven't figured out subscription models, you'll need to be on the higher end of this range to make it work.
Average eCommerce ROAS by Advertising Platform
Different platforms, different results. It's not just about where your audience hangs out – it's about how they behave when they're there.
Someone scrolling Instagram at 11 PM is in a completely different headspace than someone actively searching on Google for "best running shoes." That difference shows up in your ROAS, big time.
Here's what the data actually shows across the major advertising platforms:
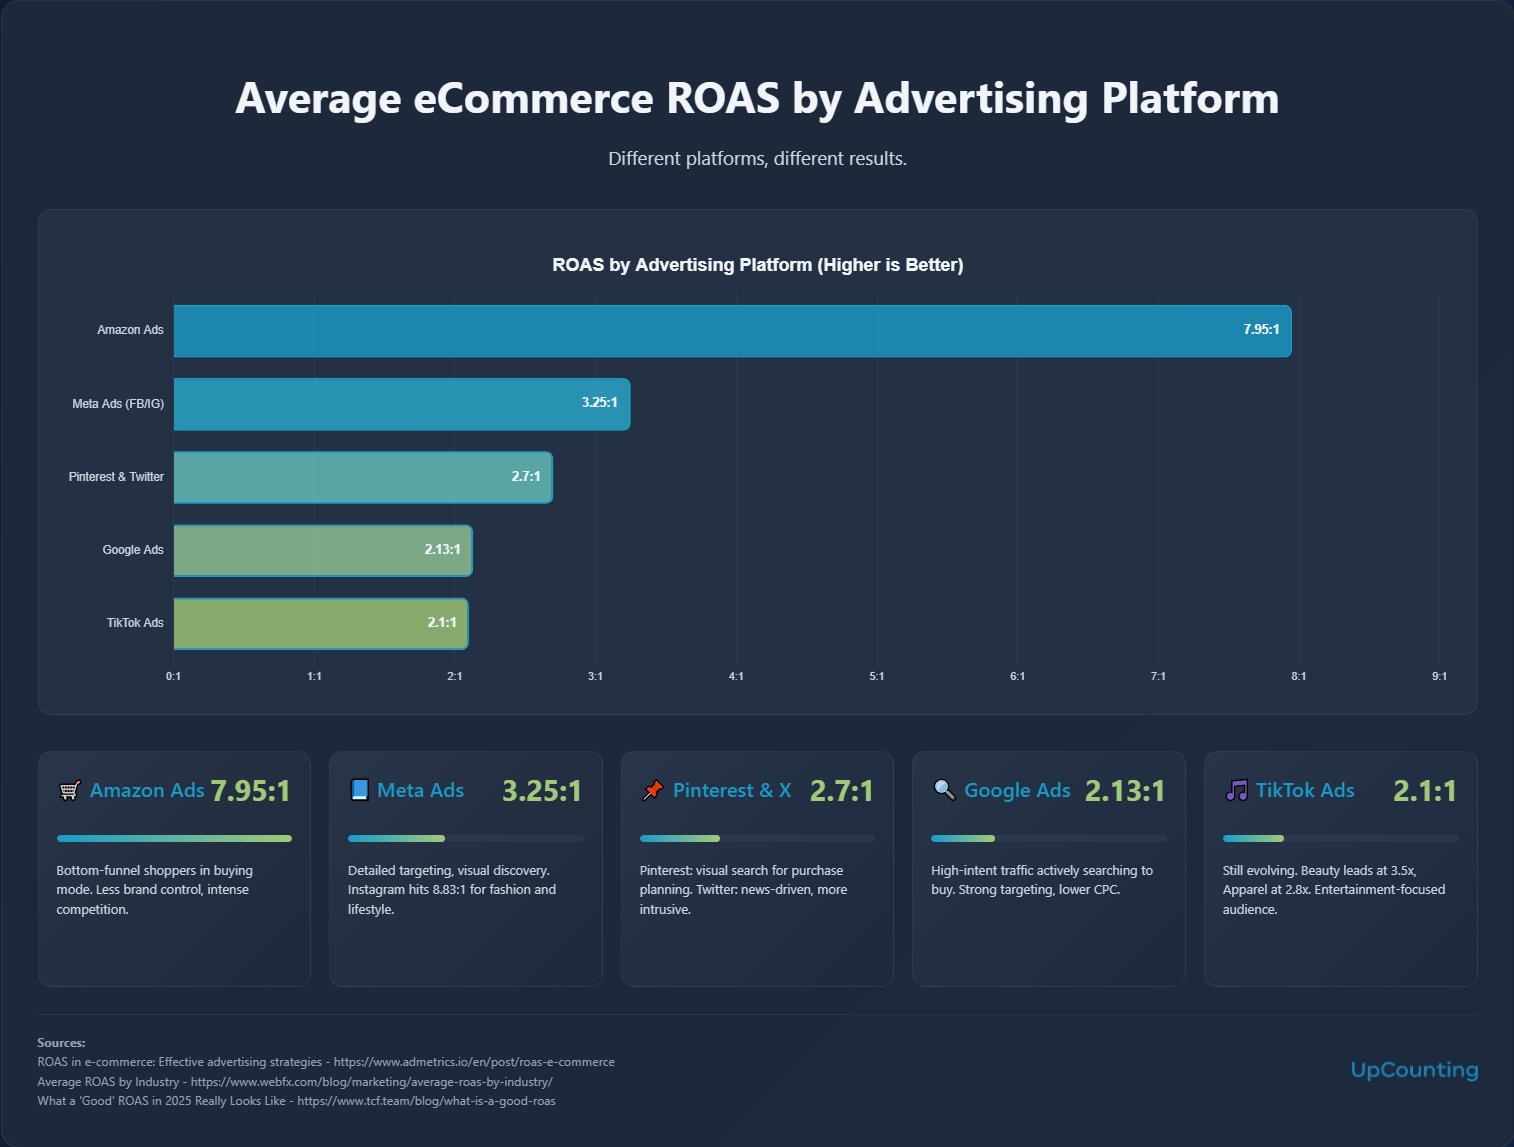
Google Ads: ~2:1 average (13.76:1 for top performers)
Google's own data suggests an average ROAS around 2:1, though this varies wildly by campaign type.
Google Shopping and Search benefit from high-intent traffic – people are actively looking to buy, not just browse.
The platform's targeting capabilities and relatively lower cost-per-click in many industries make it effective for ecommerce.
Recent analysis of paid search campaigns in 2025 found an average ROAS of 2.26x across industries.
Facebook/Instagram (Meta Ads): 2.5 to 4.0:1
Meta's massive user base and detailed targeting make it a strong performer for ecommerce.
Instagram specifically can hit 8.83:1 for visual products like fashion, home decor, and fitness.
The key difference? Instagram users seek inspiration, not direct sales pitches.
They're in discovery mode, which changes how you need to approach creative.
For impulse-purchase niches like apparel, beauty, and lifestyle products, hitting 3.0+ ROAS is generally considered strong performance.
Amazon Ads: ~7.95:1
These numbers look great because you're targeting bottom-funnel shoppers who are already in buying mode.
The catch? Less brand control and intense competition for attention.
If you're selling commodity products, the margins can get squeezed fast.
TikTok Ads: 1.7 to 2.5:1
TikTok is still evolving as an ecommerce platform.
Some brands absolutely crush it, while others struggle to convert viral moments into actual sales.
Beauty and Personal Care leads on TikTok with a 3.5x ROAS, while Apparel and Accessories follows with 2.8x.
The platform's young, entertainment-focused audience presents unique challenges for direct response advertising.
Pinterest & Twitter: ~2.7:1
Similar numbers, completely different reasons.
Pinterest acts as a visual search engine where users are actively looking for ideas and planning purchases.
Twitter's text-heavy, news-driven environment makes ads feel more intrusive.
Despite the similar ROAS, the user journey and strategy required for each platform are night and day.
Platform strategy matters as much as the numbers.
A 2:1 ROAS on Google Search from high-intent keywords might be more valuable than a 4:1 ROAS on Facebook from cold traffic, depending on customer lifetime value and repeat purchase rates.
And here's something nobody likes to talk about: CPMs are climbing.
Meta's CPMs hit $10.88 in Q1 2025, up 19.2% from the previous year.
If your ROAS targets haven't adjusted for rising costs, you're measuring success with outdated math.
Bottom line? Don't judge platforms in isolation.
A lower ROAS on one platform might be feeding higher conversions on another. Track the full customer journey, not just last-click attribution.
Why ROAS Sucks – And What to Track Instead
ROAS is the metric everyone obsesses over, but it's also one of the most misleading numbers in ecommerce.
Why?
Because ROAS only tells you one thing: how much revenue came back for every dollar you spent on ads. That's it.
It doesn't tell you if you're actually making money.
It doesn't account for your costs.
And it definitely doesn't tell you the whole truth about which marketing channels are actually working.
The Attribution Problem
Here's the uncomfortable truth: attribution is broken, and it's getting worse.
Someone sees your Instagram ad on Monday. Clicks it, browses, leaves.
Searches for your brand on Google Tuesday. Clicks again, adds to cart, abandons.
Gets a retargeting ad on Facebook Wednesday. Ignores it.
Then on Thursday, they type your URL directly into their browser and buy.
Which channel gets credit? Depends on your ecommerce attribution model.
Last-click says "direct traffic."
First-click says Instagram.
Linear says all of them equally.
And the reality?
You have no idea which touchpoint actually mattered.
With rising CPMs, stricter privacy policies, and attribution getting fuzzier by the day, brands in 2025 are waking up to a tough truth: "good" ROAS doesn't mean what it used to.
iOS updates, cookie restrictions, ad blockers – they've all made it nearly impossible to track the customer journey accurately.
So you're making decisions based on incomplete data.
You might be killing profitable channels because they don't get attribution credit, or dumping money into marketing channels that look good on paper but aren't actually driving growth.
The Real Problem: ROAS Ignores Profit
Let's say you hit a 4:1 ROAS. Sounds great, right?
You spend $10,000 on ads, generate $40,000 in revenue. But here's what ROAS doesn't tell you:
- Your product costs $15,000 to manufacture and ship
- Payment processing fees take another $1,200
- Your customer service team costs $2,000 that month
- Software and overhead is another $3,000
You just spent $31,200 to make $40,000. Your actual profit? $8,800. Not bad, but nowhere near the "4x return" ROAS suggested.
Now imagine your ROAS drops to 3:1, but you negotiate better product costs and shipping rates.
Revenue is $30,000, but your total costs drop to $20,000. You just made $10,000 – more profit at a "worse" ROAS.
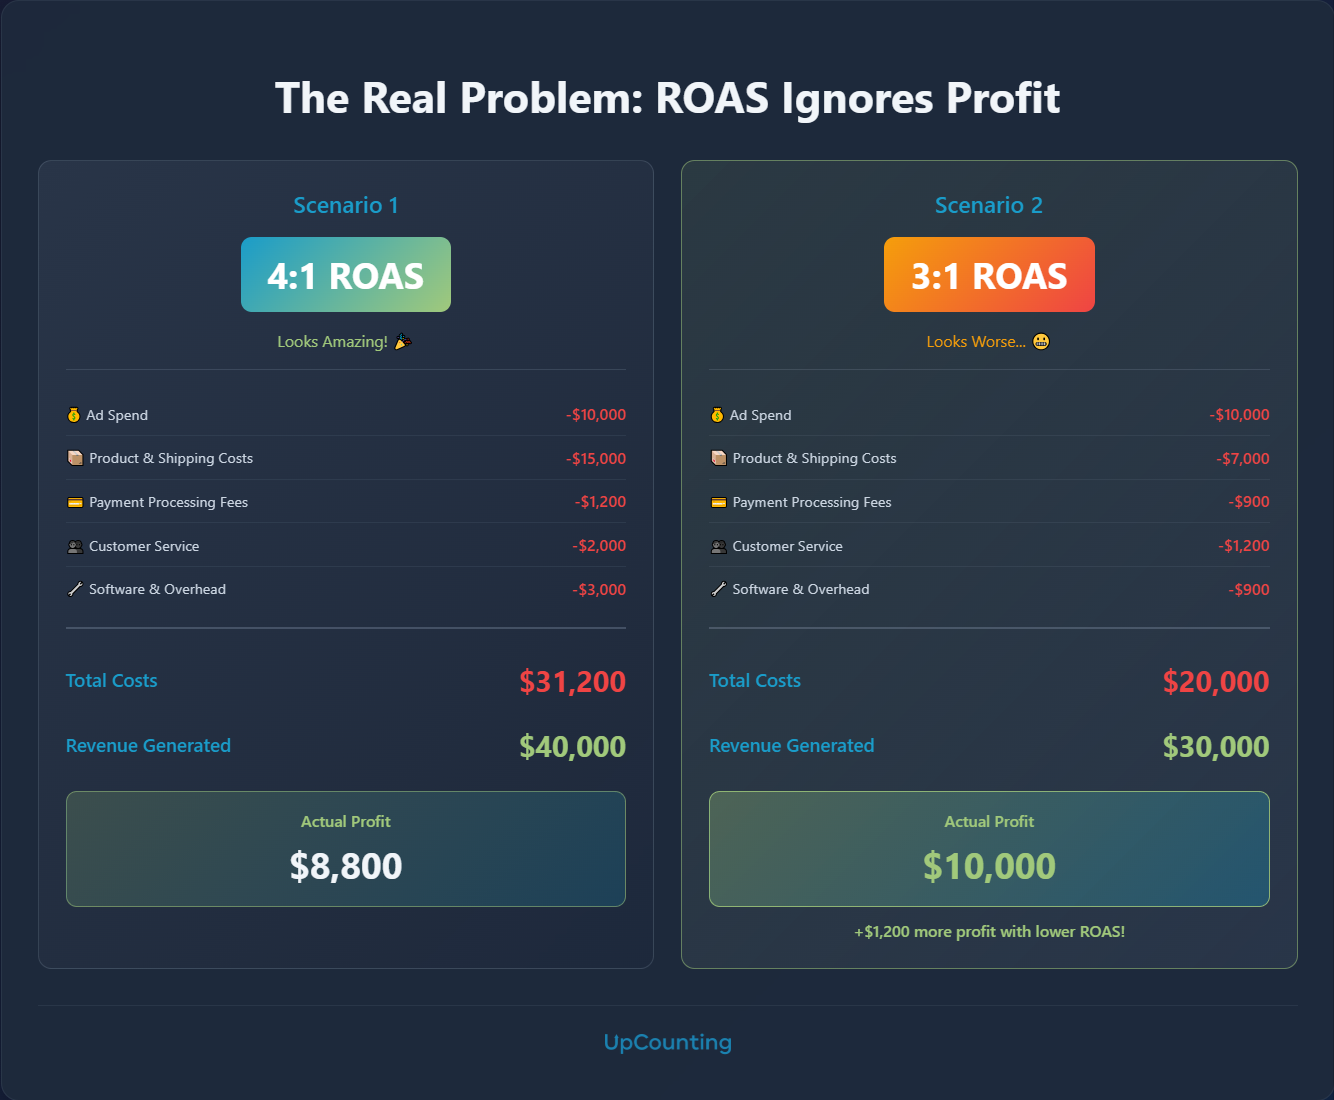
See the problem?
Track Contribution Margin Instead
Calculate your true profit margin by including every variable cost per sale.
This is your contribution margin, and it's the metric that actually matters.
Here's how it works: Take your revenue, then subtract:
- Cost of goods sold (product manufacturing)
- Shipping and fulfillment
- Payment processing fees (typically 3-5%)
- Returns and refunds
- Customer service costs allocated per order
- Ad spend
What's left? That's your ecommerce contribution margin. That's real profit.
A "bad" ROAS with strong contribution margins beats a "good" ROAS with razor-thin margins every single time.
What Else to Track
Beyond contribution margin, here are the metrics that actually tell you if your business is healthy:
Customer Lifetime Value (LTV) – If you earn repeat purchases, you can tolerate a lower initial ROAS because profit comes later.
A 2:1 ROAS on the first order might be fine if that customer buys three more times over the next year.
Payback Period – How long does it take to recoup your customer acquisition cost?
If you're break-even in 30 days and profitable by month two, you can afford more aggressive acquisition strategies.
Media Efficiency Ratio (MER) – Total revenue divided by total ad spend across all channels.
This sidesteps attribution issues entirely and shows you the big picture of whether your marketing as a whole is working.
CAC (Customer Acquisition Cost) – What does it actually cost to acquire a customer, not just generate revenue?
This matters more than ROAS if you're focused on growth.
The Bottom Line
ROAS isn't useless. It's just incomplete.
Use it as a starting point, not a scoreboard.
Stop chasing vanity metrics. Start tracking what actually determines whether your business lives or dies: profit per customer, contribution margin, and the long-term value you're building.
When you judge ROAS in context, alongside the right metrics and real business goals, it becomes useful again.
You stop optimizing for screenshots and start scaling with strategy.


.jpg)
