

After years of relentless climbing, the average eCommerce return rate might finally be leveling off—and could even dip in 2026.
Or maybe it won't. Maybe you're living it every single day and just wondering if everyone else is dealing with the same thing.
Understanding where your return rate sits compared to the industry average tells you whether you've got a problem, an opportunity, or both.
Because here's what nobody talks about enough: some returns are actually telling you something valuable.
They're data. They're feedback.
They're your customers basically raising their hand and saying, "Hey, something didn't work here."
eCommerce Return Rates in 2025 (And What to Expect in 2026)
So what does the data actually say?
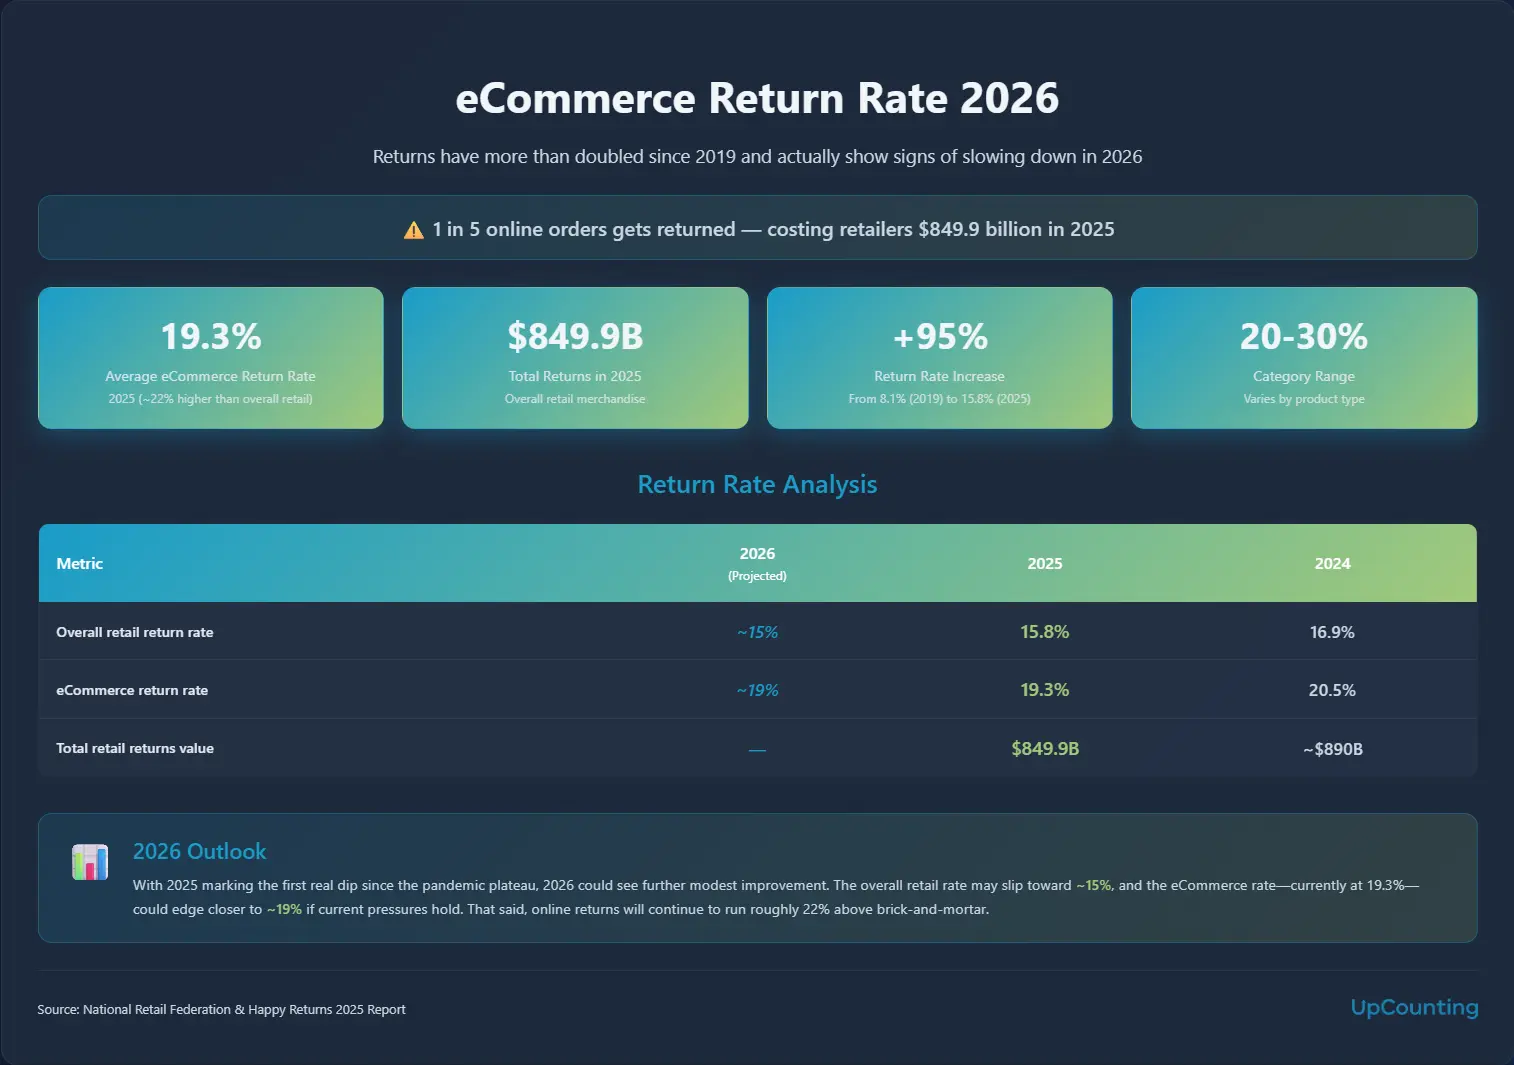
The latest report from the National Retail Federation and Happy Returns (a UPS company) shows retailers estimate the overall retail return rate will land at 15.8% of total annual sales in 2025—down slightly from 16.9% in 2024.
That's a projected $849.9 billion worth of merchandise coming back across the retail industry in 2025 (down from roughly $890 billion in 2024).
But that's overall retail—not eCommerce specifically. And online is where it really stings.
This year the report breaks out eCommerce directly: an estimated 19.3% of online sales will be returned in 2025. That's still roughly 22% higher than the overall retail rate—online returns consistently run well above brick-and-mortar.
You can see the full breakdown for yourself in the report.
What does that mean for your online store?
It means the average return rate for ecommerce is hovering just under 20%—19.3% for 2025, down from about 20.5% the year before. And if current pressures hold, it could slip a little further, toward 19%, in 2026. Some sources put it closer to 20-30% depending on your category.
Think about that. Roughly one out of every five orders—or more—might be coming back to you.
Now, if you're thinking "wait, wasn't it lower before?"—you're right.
Back in 2019, the overall return rate was 8.1%. By 2024 it had jumped to 16.9%, and in 2025 it settled at 15.8%. The explosive climb happened right after the pandemic hit—now it's leveled off.
Return rates doubled between 2019 and 2021, and they haven't come back down to pre-pandemic levels. They've plateaued at this new, higher baseline—hovering around the 16% overall / 20% online mark—but 2025's slight dip is the first real sign the tide may be turning.
Note: This article has been updated with the latest 2025 figures from the NRF and Happy Returns. We've kept the 2024 numbers as a reference point so you can see the trend, but the focus here is on where things stand in 2025 and where they're headed in 2026.
The Holiday Spike Nobody Talks About Enough
And then there's the holidays. Retailers are expecting their holiday return rate to jump another 17% above their annual average. That's on top of the already elevated baseline.
This isn't just a logistics headache. It's why 40% of retailers are bringing in third-party logistics providers for the season, and 34% are hiring additional staff just to handle returns.
They know what's coming. The question is—do you?
What to Expect in 2026
Here's the optimistic read: the average eCommerce return rate could fall to around 19% in 2026.
Retailers' top two priorities for the year are increasing online sales and reducing return rates—and after 2025's small dip, that focus could nudge the online rate down another notch.
But it's a tug-of-war, and plenty of pressure is pushing the other way:
- Customer expectations keep rising. 82% of shoppers now say free returns are an important consideration when shopping online (up from 76% last year), 81% read return policies before buying (up from 77%), and 71% say a bad returns experience makes them less likely to shop with a retailer again (up from 67% in 2024).
- Gen Z is reshaping the math. Shoppers aged 18-30 made an average of 7.7 online returns in the last 12 months—more than any other generation. As their spending power grows, so does the return volume.
- Return fraud is now a real line item. An estimated 9% of all returns are fraudulent, and nearly half of shoppers (45%) say it's acceptable to "bend the rules" when returning—especially if they're unhappy with a purchase.
- AI is the retailer's counter-move. 85% of merchants say they're using AI or machine learning in their returns process to spot and fight fraud. The catch? Only 45% believe these tools are truly effective on their own.
The takeaway for 2026: the headline rate may finally tick down toward 19%, but that modest dip masks a fierce tug-of-war.
The retailers who actually move the needle will be the ones who make returns frictionless for honest customers while quietly clamping down on the costly edge cases.
eCommerce Return Rates by Industry
Here's the reality check: if you're selling clothing online, you're playing a completely different game than someone selling electronics or furniture.
The data from Statista's Consumer Insights survey (9,778 U.S. adults surveyed from April 2024 to March 2025) breaks it down pretty clearly:
Clothing leads the pack at 25%
One in four clothing purchases gets returned. Think about that for a second. You could make four sales and watch one of them walk right back out the door.
Shoes come in second at 17%
Fit is everything with footwear, and you can't try them on through a screen. People order multiple sizes, keep one, send the rest back. Or they just don't fit right and back they come.
Accessories and Food & Beverages both sit at 12%
Accessories have similar issues to clothing—sometimes it just doesn't look right when it arrives. Food and beverages at 12% might seem high, but damaged shipments, wrong items, and quality issues add up fast.
Consumer electronics at 10%
Lower than you might expect, but electronics shoppers tend to research more before buying. When they do return, it's usually defects or compatibility issues.
Cosmetics & body care at 9%
Wrong shade, allergic reaction, doesn't smell like expected. These are personal products, and personal preferences vary wildly.
Books, movies, music & games at 9%
Pretty straightforward—either you got the wrong item, it's damaged, or you changed your mind.
Furniture & household goods at 8%
The lowest on the list, probably because furniture is a pain to return. The shipping costs alone make people think twice. Plus, these are higher-consideration purchases.

What This Means for Your Store
If you're in apparel or footwear, that 20%+ online return rate we talked about earlier? You're likely seeing even higher.
Some fashion retailers report return rates pushing 30-40%.
But here's the interesting part: 50% of respondents said they hadn't returned anything in the past year.
So returns aren't evenly distributed. Some customers return constantly, others never do.
The question you need to ask yourself: which category are you in, and what's normal for your space?
What's Driving Returns in 2025?
So we know the numbers. Returns are high, and they're staying high. But why?
Understanding what actually causes returns is where you start getting some control back.
Because some of these reasons? You can do something about them.
Others? They're just part of the game.
Sizing and Fit Issues
This is the big one for apparel and footwear. Your customer orders a medium based on your size chart. It arrives. It doesn't fit like they expected. Back it goes.
The thing is, "medium" means something different to every brand. Your medium might be someone else's large. And even within the same brand, different styles fit differently.
This is why you see people ordering multiple sizes of the same item—keeping one, returning the rest. It's called bracketing, and it's becoming standard practice for online shoppers.
Product Doesn't Match Expectations
The photos looked amazing. The description sounded perfect. Then the box arrives and... it's just not the same.
Maybe the color is off. Maybe the material feels cheaper than it looked.
Maybe it's smaller than the photos made it seem. Whatever it is, there's a gap between expectation and reality.
This isn't always about being misleading. Sometimes it's just the limitations of trying to represent a physical product digitally. But the result is the same—a return.
Quality Issues
The item arrives damaged. Or it breaks after one use. Or it just feels cheaply made compared to what the customer expected for the price.
Quality problems are straightforward returns. The customer isn't being picky—you sent them something that doesn't work or doesn't meet basic quality standards.
Buyer's Remorse
Sometimes people just change their minds. They ordered on impulse. They found it cheaper somewhere else. They decided they don't actually need it. Life happens.
This is especially common during sales events. People buy because it's a deal, not because they really want the item. Then reality sets in a few days later.
The "Wardrobing" Problem
Here's one that stings: people buy items, use them once (or wear them with tags tucked in), then return them. The dress for the wedding. The projector for the party. The outfit for the Instagram photo.
It's essentially renting from your store, except you didn't agree to run a rental business. And you're stuck with used merchandise you can't resell as new.
They Ordered From Multiple Stores
Your customer didn't just order from you. They ordered the same item from three different stores to see which one arrives first, which one looks better, or which one has the best quality.
You all shipped. Two of you are getting returns. It's inefficient for everyone, but from the customer's perspective? It's just hedging their bets.
Wrong Item or Shipping Damage
These are the straightforward operational issues. You sent the wrong size. The warehouse picked the wrong color. The shipping carrier played football with the box.
These returns are on you (or your logistics partners), and they're the ones you have the most direct control over fixing.
The reality? Most returns are a combination of these factors.
And while you can't eliminate returns entirely, understanding what's driving them in your specific store is the first step to bringing those numbers down.
The Math You Need to Run: Accounting for Returns
Let's talk numbers. Real numbers.
The kind that show up on your ecommerce financial statements and make you wonder if this whole eCommerce thing is actually profitable.
Here's the tension: 76% of consumers say free returns are an important consideration when shopping online.
But 66% of retailers have started charging for at least one return method. Somebody's math isn't adding up—or maybe it is, and that's the problem.
Let's run some scenarios so you can see what returns are actually costing you.
Scenario 1: Free Returns (The Customer-Friendly Approach)
Let's say you're doing $500,000 in annual revenue. You offer free returns because that's what customers expect, right?
With a 20% return rate, you're looking at $100,000 in returned merchandise.
But it's not just the lost sale. Here's what each return actually costs you:
- Return shipping: $8-12 per item (you're paying for it to come back)
- Processing and inspection: $5-8 per item (someone has to handle it, check it, restock it)
- Restocking and storage: $2-4 per item
- Items you can't resell: 10-25% of returns are damaged, worn, or otherwise unsellable
Let's be conservative and say each return costs you $15 in direct costs, not counting the lost sale.
If your average order value is $75, and you're getting back 6,667 orders at 20% return rate:
- Lost revenue: $100,000
- Direct return costs: $100,000 (6,667 returns × $15)
- Unsellable inventory: $15,000-25,000 (assuming 20% can't be resold at full price)
Total impact: $215,000-225,000
That's not 20% of your revenue. That's 43-45% of your revenue going toward handling returns and lost sales.
Still think that 20% return rate is no big deal?
Scenario 2: Charging for Returns (The Risk)
Now let's say you start charging $7.99 for returns. Maybe you offer free returns over a certain threshold, or for exchanges only, but standard returns cost money.
What happens?
The Good:
- Your return rate might drop to 12-15% (people think twice before returning)
- You recoup some costs: 4,000 returns × $7.99 = $31,960 in return fees collected
- Lower processing volume means lower operational costs
The Bad:
- Conversion rate typically drops 10-20% when you add return fees
- On $500,000 revenue, a 15% conversion drop = $75,000 in lost sales
- Customer lifetime value decreases (they shop where returns are easier)
Let's do the math with a 15% conversion drop and 14% return rate:
- New revenue: $425,000
- Returns: $59,500 in returned merchandise
- Return fees collected: +$31,960
- Direct return costs: -$35,700 (3,570 returns × $10 average cost after collecting fees)
- Lost revenue from lower conversion: -$75,000
Net impact: roughly $78,000 in losses
Better than $215,000, but you're also doing less business overall.
Scenario 3: Building Returns Into Your COGS (The Honest Approach)
Here's what most successful eCommerce brands have figured out: returns aren't a bug, they're a feature. So treat them like one.
Take that 20% return rate and build it into your cost structure from day one.
If your actual COGS is $30 per item and you sell for $75, you might think you have a 60% margin. But if 20% comes back, your real margin is different.
The real math:
- Sale price: $75
- COGS: $30
- Return costs (20% × $15 per return): $3 per sale
- Effective COGS: $33
- Real margin: 56%
Now you're pricing honestly. You know what your actual costs are, and you can make informed decisions about:
- Can you afford free returns? (Maybe)
- Can you afford free shipping? (Factor that in too)
- What's your real profit margin? (Lower than you thought)
- How much room do you have for customer acquisition costs?
So What Should You Do?
Here's the truth: there's no one-size-fits-all answer. But here are the questions you need to answer:
What's your customer lifetime value?
If customers buy from you multiple times, eating the cost of returns on the first order might be worth it. If you're mostly one-and-done purchases, you need to be more careful.
What's your competitive position?
If you're competing on price in a crowded market, you probably can't afford to charge for returns when your competitors don't. If you have unique products or a strong brand, you have more flexibility.
What's actually coming back?
Track your return reasons. If 80% of returns are sizing issues on one product line, fix the sizing. That's cheaper than processing returns forever.
Can you segment your return policy?
Maybe returns are free for loyalty members. Maybe exchanges are free but refunds cost money. Maybe returns are free above a certain order value. Test different approaches.
What would happen if you raised prices 5% and offered free returns?
Sometimes the answer isn't choosing between returns and revenue—it's building the cost into your pricing and being transparent about it.
The worst thing you can do is ignore the math. Returns are going to happen.
The question is whether you've planned for them or whether they're going to slowly eat into your profitability until you wonder why this business isn't working.
Run your own numbers. Look at your actual return rate, your actual costs, your actual margins. Then make a decision based on reality, not on what you hope will happen.
Because hope isn't a business strategy. But math is.
And if the math feels overwhelming or you're not sure your books are telling you the real story, we can help.
We work with eCommerce businesses to uncover their true costs—including the hidden impact of returns—so you can make decisions based on actual numbers, not guesswork.
Schedule a free consultation to get clarity on your profitability.


.jpg)
