
Your customers are buying less per order than you think they should. And you're probably right to be worried about it.
The average eCommerce cart in 2025 sits around $150 globally.
Some industries are way higher. Some are way lower.
The question is: where do you fall, and does it actually matter?
Here's what most people get wrong—they obsess over getting customers to spend more per order without asking if those customers should even be spending more.
A bigger cart sounds great until you realize you're discounting yourself into oblivion or selling bundles nobody actually wants.
So let's cut through the noise. What's normal for your industry?
What are your customers actually willing to spend?
And what levers can you pull that won't just inflate your numbers but actually make you more money?
We're going to look at the real data, break down what's working in 2025, and figure out if your cart size is a problem worth solving—or if you should be focused on something else entirely.
The Average Cart Size for Online Shopping
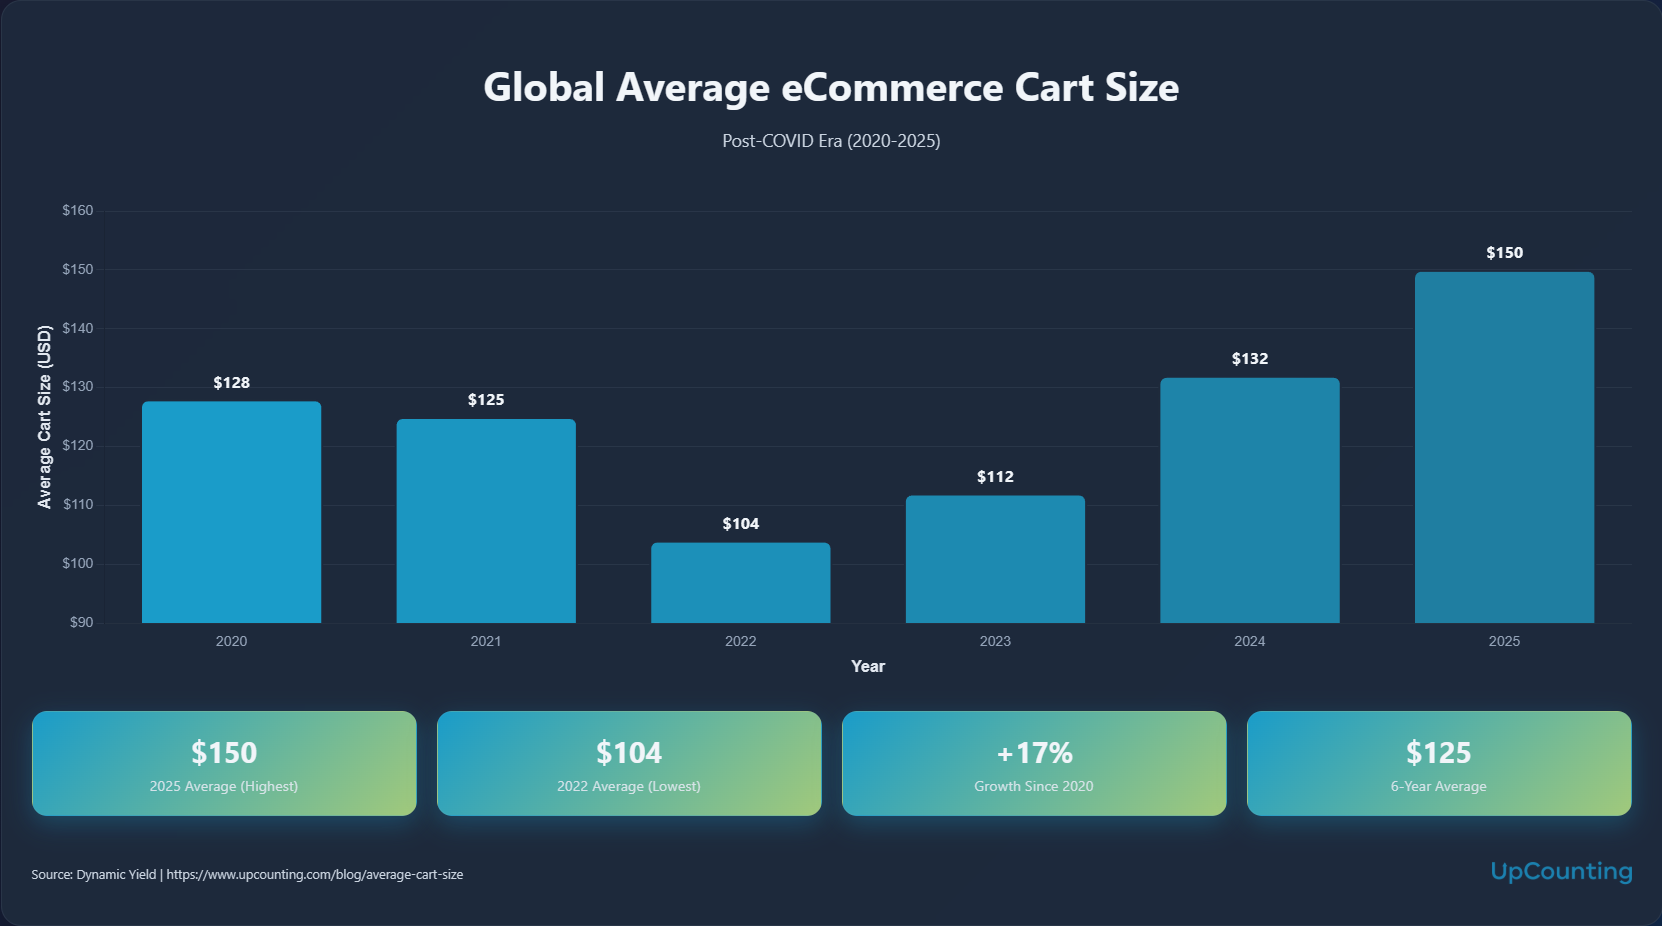
Global average order value hit $150 in 2025.
That's the headline. But here's what makes it interesting: five years ago in 2020, it was roughly the same neighborhood.
Then it crashed to $104 in 2022. Climbed back to $112 in 2023. Hit $132 in 2024. And now we're at $150.
So what happened?
The pandemic sent everyone online and cart values initially held steady.
Then 2022 hit—inflation, economic uncertainty, people tightening their wallets—and spending per order dropped hard.
We're talking a 16% decline if you compare 2022 to the years before it.
But since then? Steady recovery. A 44% increase from that 2022 low point to where we are now.
Here's what this tells you: cart size isn't static.
It moves with the economy, with consumer confidence, with how comfortable people feel spending money online.
The fact that we're back above pre-pandemic levels suggests people aren't just buying online more—they're buying more online.
The question for you is simple: did your average order value follow this trend, or did you get stuck somewhere around that 2022 low?
Because if the global average is climbing and yours isn't, that's not a market problem.
Average Cart Size by Industry Benchmarks
Your industry matters more than any global benchmark ever will.
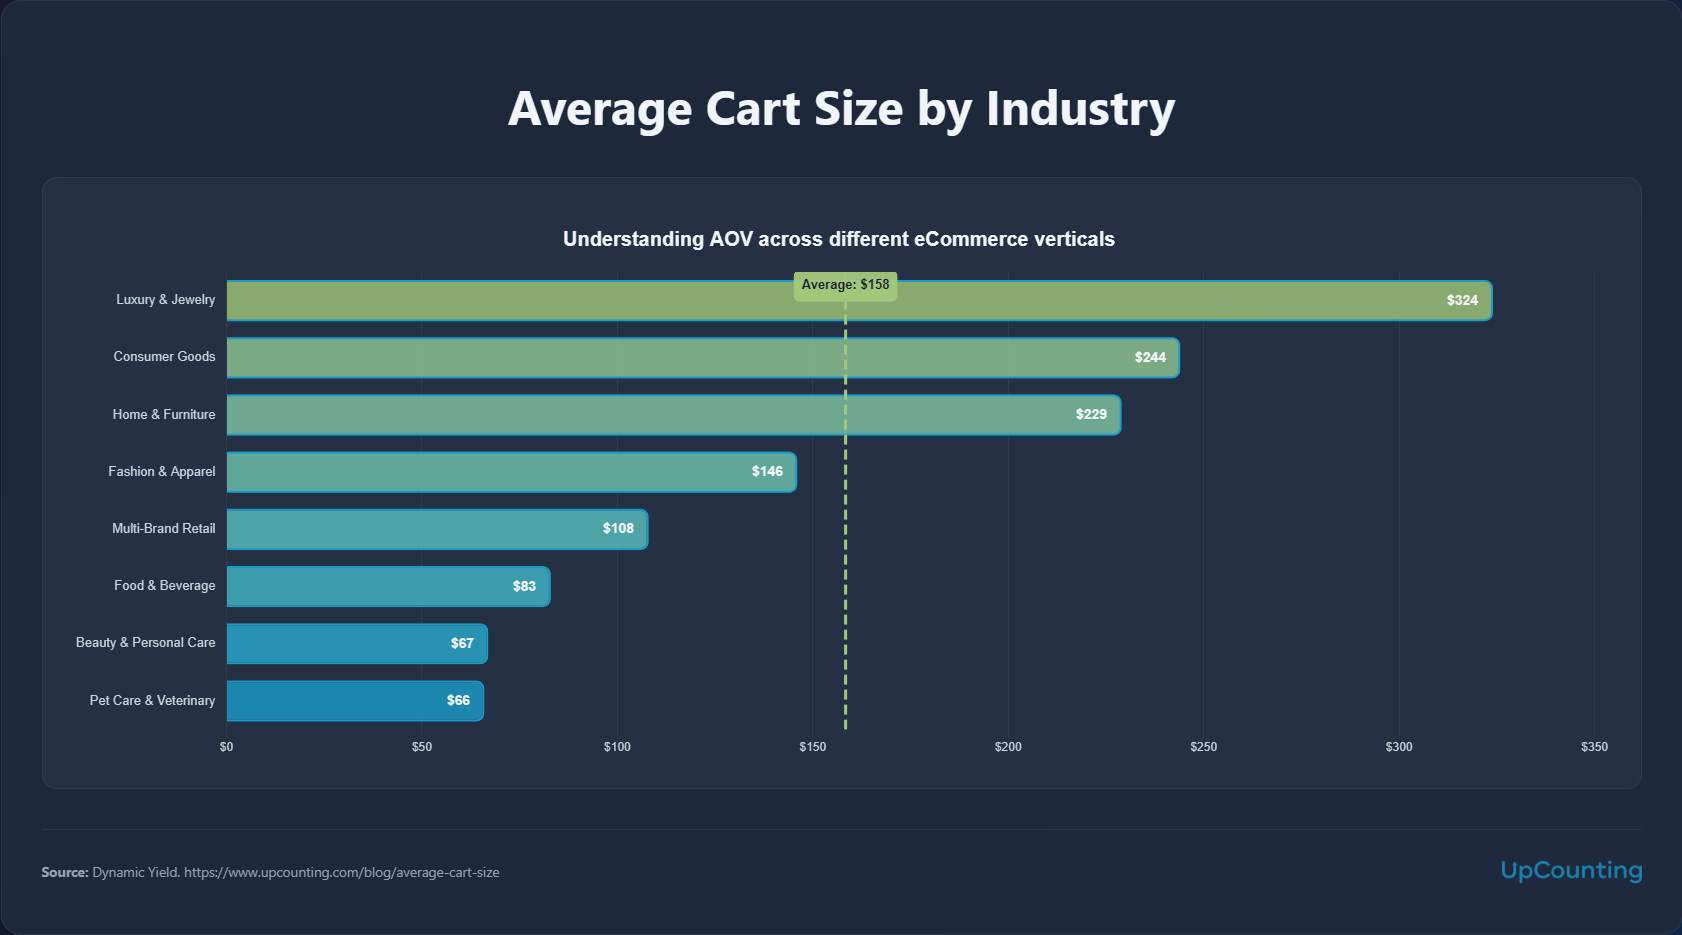
Here's the reality across eight major verticals:
The gap between the top and bottom is almost 5x.
Luxury jewelry customers spend $324 per order. Pet care customers spend $66.
Both can be wildly profitable businesses, but they're playing completely different games.
If you're in beauty or pet care and stressing about a $67 cart, stop.
You're right where you should be. These are repeat-purchase categories.
People aren't loading up their cart with six months of shampoo or dog food in one go—they're buying what they need now and coming back next month.
Your focus shouldn't be cart size, it should be purchase frequency and customer lifetime value.
If you're in home & furniture pulling $229 per order, that makes sense too.
People don't casually add a couch to their cart. They're making considered purchases, and when they do buy, they're spending real money.
But they're also not coming back every month. You get fewer shots, so each one has to count.
Fashion sits right at the global average ($146). Interesting spot to be in.
You're not high-ticket enough to wait around for big purchases, but you're not low-ticket enough to rely purely on volume.
This is where bundling, outfit suggestions, and "complete the look" upsells actually start to matter.
The point?
Don't benchmark against "eCommerce." Benchmark against your actual category.
A $150 cart in pet care would be incredible. A $150 cart in luxury jewelry means something is very broken.
Average Online Cart Size by Region
Where your customers live changes how much they spend. Not a little—a lot.
Americas shoppers are outspending everyone else by 41%. APAC and EMEA are basically tied, both sitting right around that $132 mark, while Americas customers are dropping $186 per order.
Why does this matter?
Because if you're running a global store and treating every customer the same, you're leaving money on the table in some regions and probably confusing people in others.
Americas customers have higher spending power right now, or they're more comfortable making larger online purchases, or both.
If you're heavily weighted toward Americas traffic, your overall AOV should be higher than the global average. If it's not, you've got optimization work to do.
APAC and EMEA sitting at the same level is interesting too—these are wildly different markets with different currencies, different purchasing behaviors, different logistics costs.
But the cart sizes have converged. That suggests eCommerce behavior is normalizing globally, even if spending power isn't.
But here's the thing about those regional averages: they're hiding massive variance.
APAC includes Japan (high spending power) and Indonesia (very different economics).
EMEA lumps together Germany, the UK, Romania, and Saudi Arabia.
A shopper in Singapore and a shopper in Vietnam aren't operating with the same cart dynamics, even though they both get bucketed into "APAC."
So if you're digging into your own analytics and seeing wildly different AOVs by country within these regions—that's normal.
The regional average is useful for the big picture, but country-level data is where you'll actually find opportunities.
Here's the uncomfortable question: if you're selling globally, are you pricing appropriately for each region?
Are your shipping thresholds adjusted?
Are you offering payment methods that make sense locally?
Because a $186 AOV in Americas and a $132 AOV in EMEA might mean your EMEA customers want to buy from you, but your checkout experience is making harder than it needs to be.
Average Cart Size by Device
The device someone uses to buy from you isn't just a technical detail—it's a predictor of how much they'll spend.
Desktop shoppers spend 37% more than mobile shoppers. That's a $51 gap per order.
Multiply that across hundreds or thousands of transactions and you're looking at real money left on the table if your mobile experience isn't dialed in.
Tablet and mobile are basically neck and neck, both hovering around $138.
Desktop is in its own category at $188—almost exactly matching the Americas regional average, which isn't a coincidence.
Here's what this usually means: people browse on mobile, buy on desktop.
Or they're buying low-consideration stuff on mobile (reorders, small purchases, impulse buys) and saving the bigger decisions for when they're sitting at a computer with a bigger screen and a real keyboard.
But here's the part most people miss: mobile isn't "worse." It's different.
A $137 mobile cart isn't a failure if that customer is buying frequently.
The real question is whether your mobile experience is optimized for what mobile shoppers actually do—quick checkouts, saved payment info, easy reordering—or whether you're just hoping your desktop site shrinks nicely onto a phone screen.
And if you're seeing desktop orders consistently outpace mobile by this much, ask yourself: are people choosing desktop, or are they forced to desktop because your mobile checkout is a nightmare?
There's a difference between "I prefer to buy on my laptop" and "I gave up on mobile and switched devices out of frustration."
The play here isn't to make mobile match desktop.
It's to understand what each device is good for and optimize accordingly.
Desktop for considered purchases with larger carts. Mobile for speed, convenience, and repeat buys.
Stop trying to force the same experience everywhere.
The Accountant's Perspective: Bigger Carts Don't Always Mean More Money
A higher cart size doesn't automatically mean you're making more money.
Every eCommerce owner gets obsessed with cart size because it feels like progress.
"$150 carts instead of $100 carts? We're winning!"
Except you might not be. You might actually be losing.
The math most people ignore: contribution margin.
That's revenue minus the variable costs directly tied to that sale—product cost, payment processing, shipping, packaging, discounts.
What's left over is what actually contributes to covering your fixed costs and (hopefully) profit.
Let's say you boost your AOV from $100 to $150 by offering free shipping on orders over $125.
Sounds great.
But if your margins are tight and shipping costs you $15 per order, you just gave away $15 to gain $50 in revenue.
If your product margin is 40%, you made $20 in gross profit on that extra $50, but you spent $15 to get it.
Net gain? $5.
And that's before you factor in the increased transaction fees on the larger order.
Or worse: you run a "buy 2, get 20% off" bundle to increase cart size.
AOV goes up.
But if you're selling products with a 35% margin and you're discounting 20%, your actual profit per item just got sliced.
You moved more units, your AOV looks impressive in the dashboard, but your bank account tells a different story.
The numbers you actually need to know:
- What's your contribution margin per order at different AOV levels?
- Are your tactics to increase cart size (free shipping thresholds, discounts, bundles) actually improving that margin, or just inflating vanity metrics?
- At what order value do you start losing money on the deal?
If you don't have these numbers dialed in, you're flying blind.
You could be celebrating a 30% increase in AOV while your profit margin drops by 10%.
The dashboard looks green, the P&L looks red.
This isn't about avoiding discounts or free shipping or bundles—those pricing tactics work.
But they only work if you've done the math first. If you know your unit economics cold. If you can say with confidence, "At $150 AOV with this offer, we're still contributing $X per order."
Most stores can't say that. They're guessing. And guessing can be expensive.
Want to stop guessing and actually see where your money's going? Get in touch—we'll help you figure out what those bigger carts are really costing you.


.jpg)


