
The add to cart rate—the percentage of visitors who actually click that button and put something in their cart—is one of those metrics that separates window shoppers from people who might actually buy.
It's not the same as a purchase (we've all abandoned carts), but it's the first real sign of intent. The moment someone goes from "just looking" to "okay, I'm interested."
But how do you actually know if your add to cart rate is good or terrible?
Are you comparing yourself to fashion brands when you're selling electronics? Are you beating yourself up over mobile numbers that are actually industry-leading?
Most store owners have no idea if their 8% add to cart rate is amazing or abysmal.
Because the truth is, it depends. On your industry.
On whether people are shopping from their phone or laptop. On where in the world they're browsing from.
So what's actually average? What should you be aiming for? And more importantly, how do you know if the problem is your product, your pricing, or just the fact that you're in an industry where people research for weeks before adding anything to cart?
Let's figure it out.
What is the Average Add to Cart Rate?
Before we dive into the numbers, let's address something: add to cart data varies depending on who's doing the research.
Different platforms track different stores, different industries, different customer segments. One report shows 9%, another shows 5%, and suddenly you're second-guessing everything.
So we're going to keep this consistent.
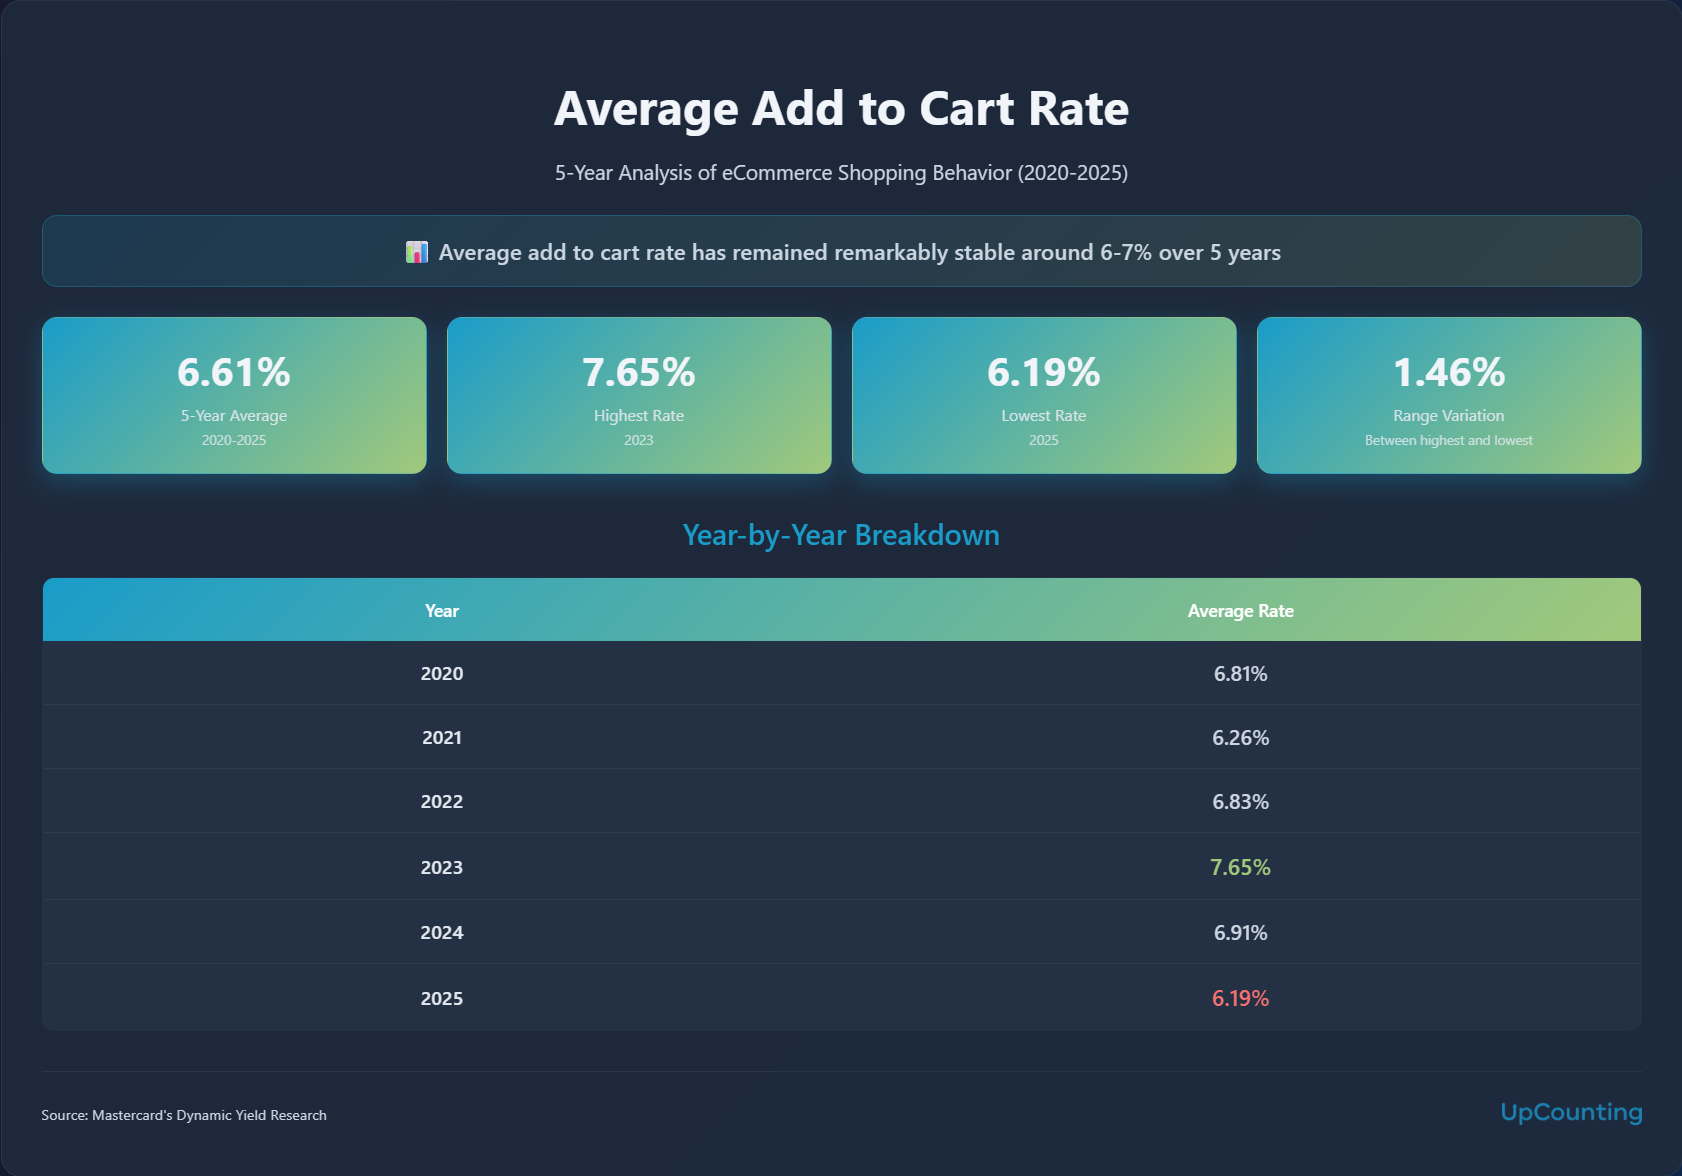
We're sticking with data from Mastercard's Dynamic Yield research, which has been tracking add to cart rates consistently over time. We'll look at the 5 year period from late 2020 through 2025.
That timing matters—2020 marks the beginning of the post-COVID ecommerce era, when online shopping fundamentally shifted from convenience to necessity for millions of people.
Same source, same methodology, five years of data tracking this new normal.
Here's what that looks like:
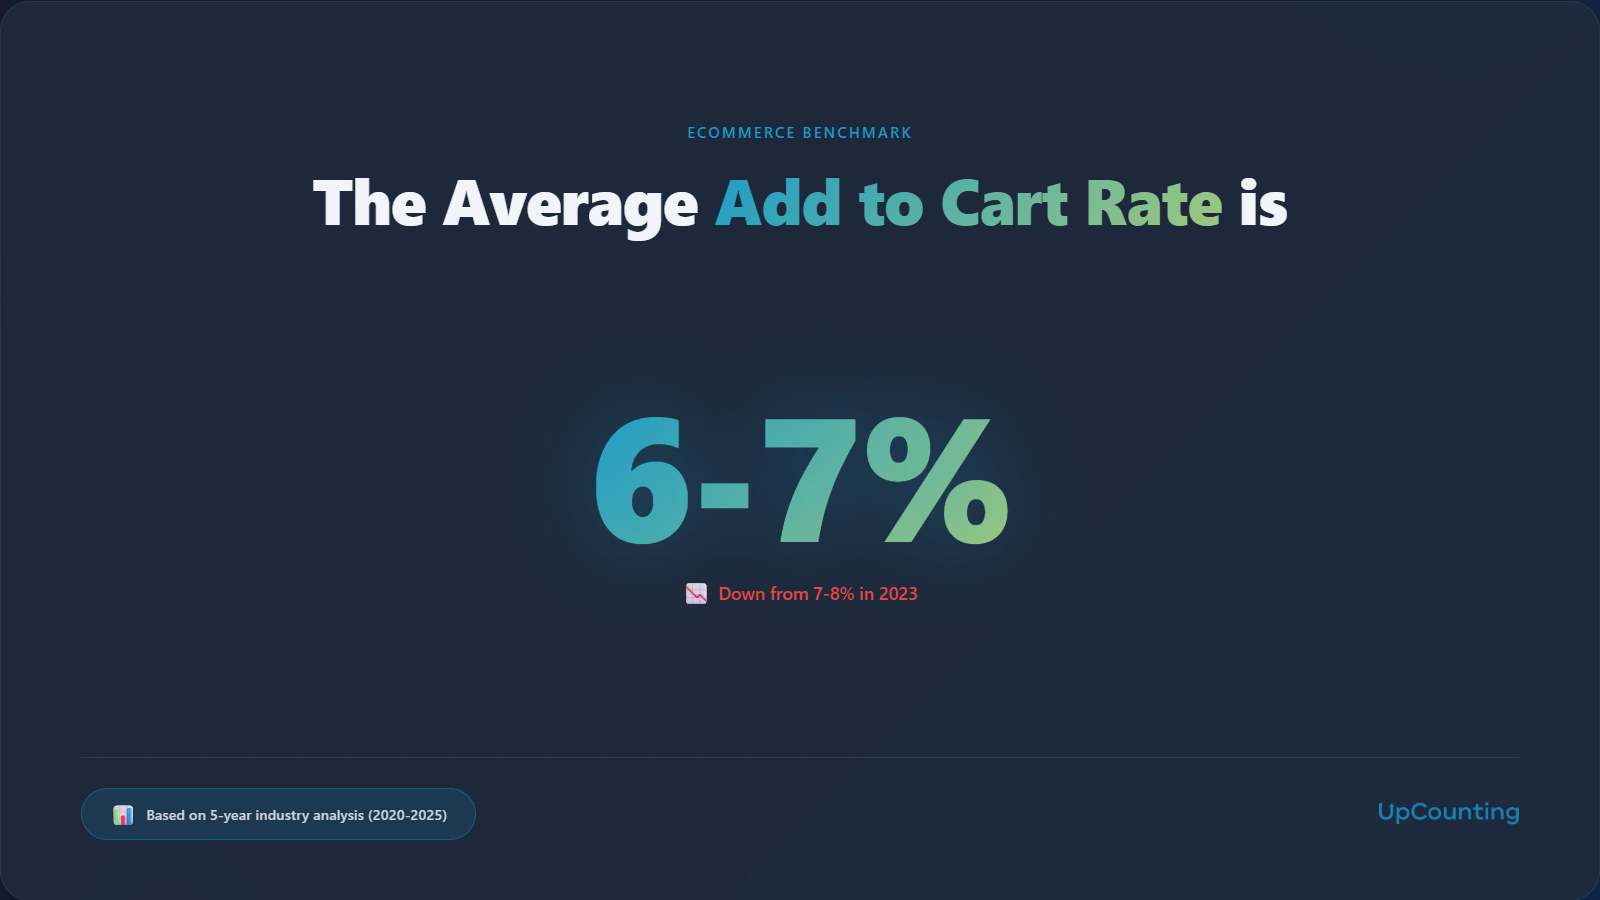
This shows that the average add to cart rate for ecommerce is around 6% to 7% over the last 5 years.
We're now sitting at around 6% for late 2025, down from that 7-8% range we were seeing in 2023.
Is that good? Bad? Well, it depends what you're comparing it to.
But if you're hovering around 6-7% right now, you're not alone. That's pretty much where the average ecommerce store is sitting.
By Device
But here's where it gets interesting. That 6% average? It's not the same across all devices.
You'd think desktop would win this one, right?
Bigger screen, easier to browse, better images, clearer call-to-action buttons. Makes sense that people on a laptop would be more likely to add items to their cart.
Except that's not what the data shows.
Mobile is winning. And not by a tiny margin—it's beating desktop by half a percentage point, which might not sound like much, but when you're talking about add to cart rates, that's significant.
Here's a theory: mobile isn't where people buy—it's where they bookmark.
Think about your own behavior. You're scrolling Instagram or browsing on your lunch break, you find something you like, and you're not ready to pull out your credit card right there.
But you don't want to lose it either. So you add it to cart.
The cart becomes your wishlist. Your "I'll deal with this later when I'm at my computer" list.
Then you get home, open your laptop, log into the site, and there's your cart waiting for you.
Now you can actually look at the product details, read reviews, compare it to other options, maybe even add a few more things.
Desktop becomes the research and decision-making environment.
Tablets are sitting right in the middle at 6.15%, which makes sense.
They're kind of the forgotten middle child of ecommerce—comfortable to browse on, but not as convenient as a phone and not as comprehensive as a desktop.
The takeaway?
If your mobile add to cart rate is lower than 6.31%, that might be your opportunity.
But don't celebrate high mobile add to cart rates without looking at what happens next.
Are those mobile adds actually converting to purchases, or are they just disappearing into the cart abandonment void?
By Region
Geography matters too. And not in the ways you might expect.
The Americas are leading at 6.62%—North and South America combined. EMEA (Europe, Middle East, and Africa) is close behind at 6.27%.
But then there's APAC (Asia-Pacific) sitting at 4.74%, almost two full percentage points below the Americas.
That's... interesting.
You'd think APAC would be crushing it. This is the region that practically invented mobile commerce.
China's been buying everything through WeChat for years. Southeast Asia lives on their phones.
The infrastructure is there, the mobile adoption is there, the comfort with digital payments is definitely there.
So why the lower add to cart rate?
Maybe it's a measurement thing. A lot of APAC commerce happens on super-apps and marketplaces that might not be fully captured in this data.
When you're buying through WeChat or LINE or Grab, is that even registering the same way as a traditional ecommerce "add to cart"?
Or maybe it's cultural. In markets with incredibly competitive pricing and instant delivery options, people might shop differently.
Either way, if you're selling globally, don't expect your add to cart rate to look the same across regions.
A 4.74% in APAC might be just as healthy as a 6.62% in the Americas—they're just different markets with different shopping behaviors.
Average Add to Cart Rate by Industry
Now here's where things get really interesting.
Because that overall 6% average? Completely meaningless if you don't know what industry you're in.
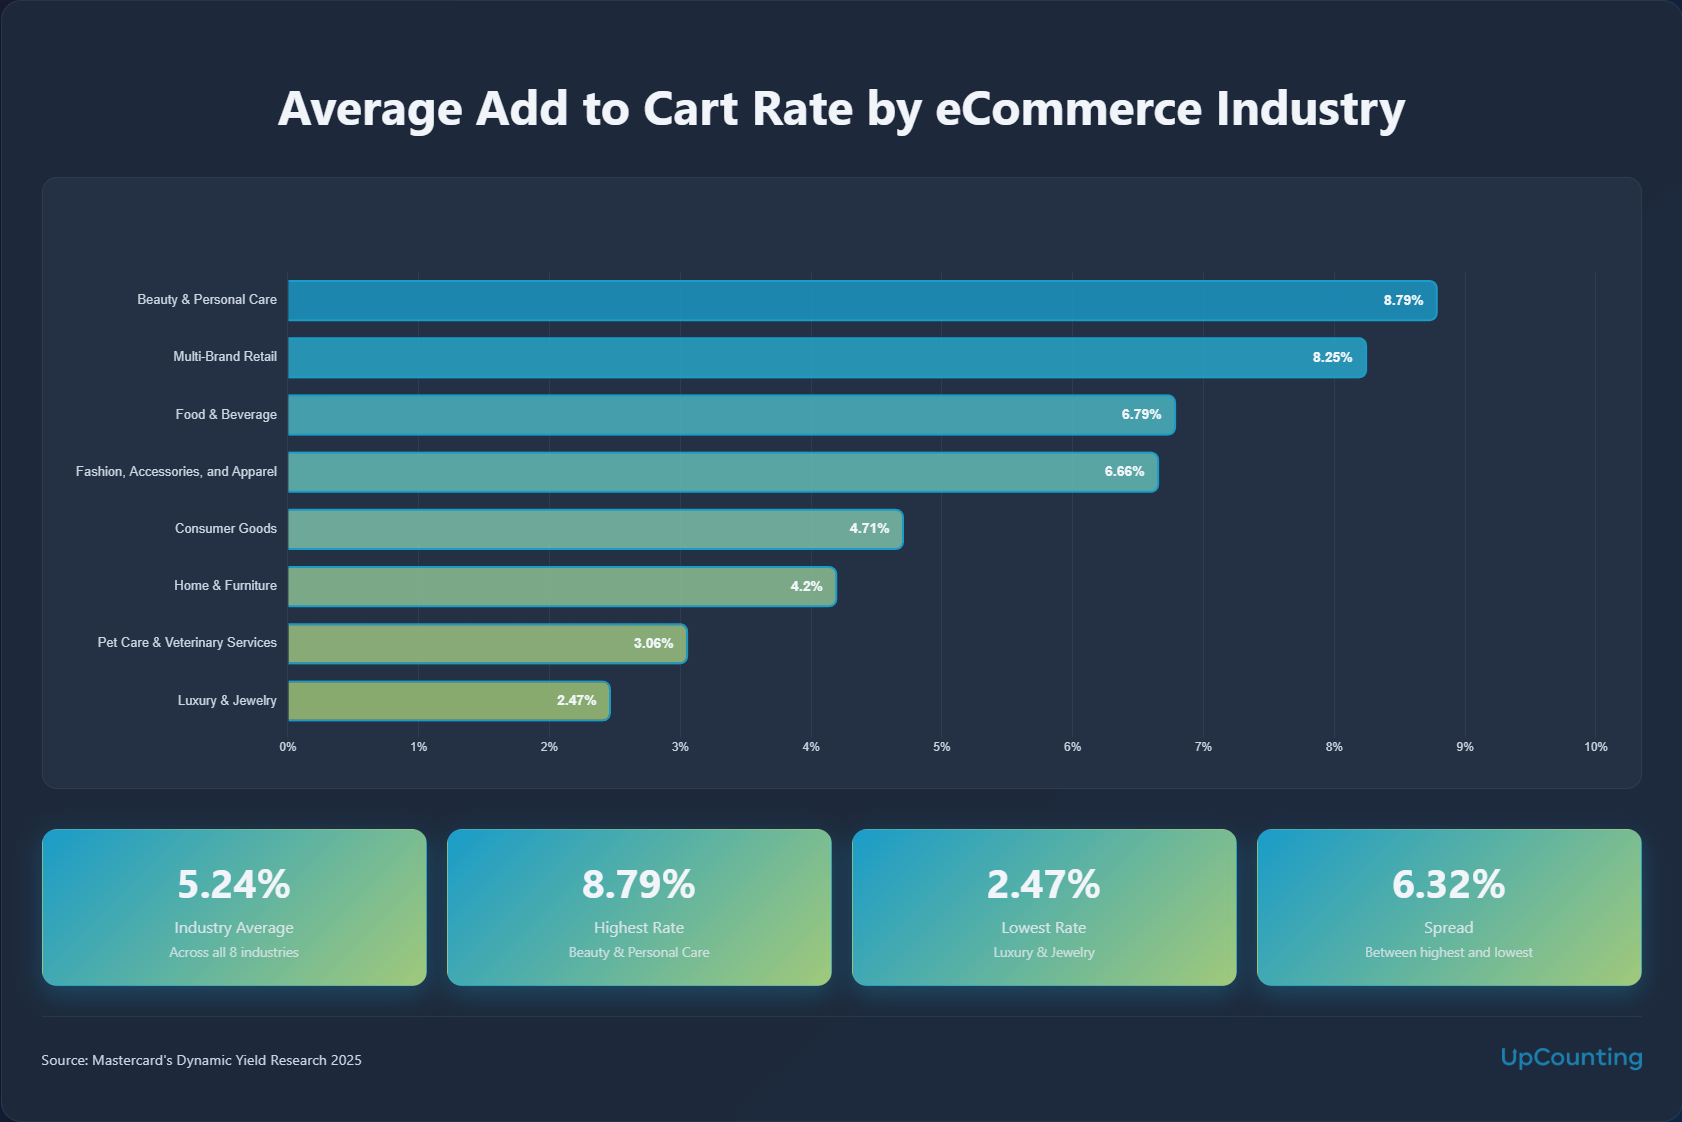
Look at that range. Beauty is at 8.79%, luxury jewelry is at 2.47%. That's more than a 3x difference.
If you're selling beauty products and your add to cart rate is 5%, you're underperforming. But if you're selling luxury jewelry and you're at 5%? You're absolutely crushing it—doubling the industry average.
So what's going on here?
Beauty and personal care leading at 8.79% makes sense
These are often repeat purchases—you know you like that moisturizer, you're running out, you add it to cart. Lower prices, less risk, more impulse buying.
Plus, beauty is one of those categories where people genuinely enjoy shopping. It's not a chore, it's a treat.
Multi-brand retail at 8.25% is interesting
These are the department store type sites—lots of variety, lots of categories. You come in looking for one thing, you end up adding three more.
The browsing experience is part of the appeal.
Food & beverage at 6.79% is right around that average
Makes sense—some people are just restocking their favorites (easy add to cart), others are trying new things (maybe need to think about it).
Fashion at 6.66% feels about right too
Fast fashion probably pushes this number up (cheap, trendy, why not?), while higher-end fashion probably brings it down (need to think about fit, style, whether it's worth it).
But then we get to the big-ticket, high-consideration purchases.
Home & furniture at 4.20%
Yeah, you're not casually adding a $2,000 couch to your cart.
You're measuring your space, checking reviews, comparing it to seventeen other couches, asking your partner, your friends, maybe even your therapist.
The add to cart button is a big commitment here.
Pet care at 3.06% is surprisingly low
You'd think people would impulse-buy for their pets, but maybe the services side brings this down? Or people are more careful about what they feed their animals than themselves?
Luxury & jewelry at 2.47% is the lowest
And honestly, that makes perfect sense. You don't just stumble upon a $5,000 watch and throw it in your cart.
This is serious research territory. You're reading about the brand, the craftsmanship, the warranty, whether it'll hold value. And you're probably visiting the site multiple times before you even think about adding to cart.
The lesson? Stop comparing yourself to "the average ecommerce store." Compare yourself to stores in your actual industry. A 4% add to cart rate isn't bad—it might be exceptional, depending on what you're selling.
Accounting for a Low Add to Cart Rate
So what can you do to bump those numbers?
You've probably read a dozen articles telling you to offer free shipping, throw in a 10% discount code, or run an exit-intent popup with a special offer.
And yeah, those tactics work. They absolutely can recover abandoned carts and boost your conversion rate.
But every discount you offer comes straight out of your margin.
And if you don't know your numbers—I mean really know them—you might be "winning" customers while quietly losing money on every sale.
Let's talk about what actually matters here.
Contribution margin
That's what you have left after you subtract the direct costs of making or acquiring your product.
If you're selling a $50 item that costs you $30 to source or produce, your contribution margin is $20.
That's what you have to cover everything else—your ad spend, your platform fees, your customer service, your rent, your salary.
Now, you offer a 15% discount to boost add to cart rates. Suddenly that $50 item is $42.50, and your contribution margin just dropped from $20 to $12.50.
You cut your margin by 37.5% to get a customer who might not have even needed the discount to buy.
Customer acquisition cost (CAC)
How much are you spending to get someone to your site in the first place?
If you're running Facebook ads at $2 per click, and it takes 50 clicks to get one add to cart (that's a 2% add to cart rate), you just spent $100 to get someone to put something in their cart.
They haven't even bought yet.
This is where your marketing channels matter.
Organic traffic has a different cost structure than paid ads.
Email to existing customers is essentially free compared to cold traffic from Instagram.
A customer who finds you through Google search is probably already closer to buying than someone who saw your retargeting ad for the third time.
Pricing tactic
You can play with perception with different pricing tactics. $49.99 feels different than $50.
Free shipping over $75 might get people to add more to cart rather than discounting the base price.
Bundles change the math entirely—suddenly that $20 margin becomes $35 because you moved three products instead of one.
But again, it's not just about getting the add to cart. It's about getting profitable add to carts.
Chargebacks and fraud
Nobody talks about this, but it matters.
Higher add to cart rates from aggressive discounting can attract the wrong kind of customer.
People who abuse return policies.
Fraudulent orders that you don't catch until you've already shipped.
Every chargeback costs you the product, the shipping, and a fee to your payment processor.
You can have a great add to cart rate and still be bleeding money.
Ad budget allocation
Should you be spending money to increase your add to cart rate at all?
Or should you be focusing that budget on converting the people who already added to cart?
Maybe your add to cart rate is fine, and the real problem is that 80% of those carts are abandoned.
Testing different shipping speeds, payment options, or checkout flows might be a better use of resources than driving more top-of-funnel traffic.
The point is: add to cart rate is a number. A useful number, sure. But it's not the goal. The goal is profitable growth.
You can have an 8% add to cart rate and be losing money. You can have a 3% add to cart rate and be printing cash. It all depends on what happens before and after that click.
Run your own numbers. Look at your actual return rate, your actual costs, your actual margins. Then make a decision based on reality, not on what you hope will happen.
Because hope isn't a business strategy. But math is.
And if the math feels overwhelming or you're not sure your books are telling you the real story, we can help.
We work with eCommerce businesses to uncover their true costs, so you can make decisions based on actual numbers, not guesswork.
Schedule a free consultation to get clarity on your profitability.


.jpg)


